How Skeletal Frame Size Affects Body Mass Index Interpretation
Skeletal frame size, measured by wrist circumference or elbow breadth, explains a small fraction of BMI variation between individuals—far less than is often claimed.
Skeletal Frame Size and BMI: How Much Variation Does Bone Structure Explain
Skeletal frame size explains less BMI variation than most people assume. The question is not whether frame size matters. It does. The question is how much of the difference between two people at the same height who weigh different amounts is bone, not fat or muscle. The answer from anthropometric research: about 3 to 5 percent of the variance in BMI between individuals.
That figure comes from studies that used wrist girth, elbow width, and biacromial span, not from self-reported frame size categories on a health questionnaire. Measure the skeleton instead of guessing its size, and the contribution of bone structure to total body weight variation is modest. The popular claim that a large-framed person can carry more weight than a small-framed person at the same height and still have the same body composition is a rough heuristic. It is not a validated adjustment.
Measurement Protocols for Frame Size
This guide covers the protocols for wrist girth, elbow width, and biacromial span, then shows what those numbers actually do to BMI interpretation. Get the inter-observer error for each technique before any figures are discussed. The precision of the tool determines how much trust to place in the classification.
What Frame Size Measurement Looks Like in Practice
Skeletal frame size is not a visual judgment. It is a named anthropometric variable with published protocols and reference tables. The two most common methods are wrist girth and elbow width. Both carry known measurement error that affects classification accuracy.
Wrist Girth Measurement
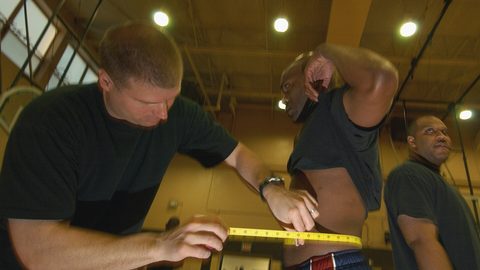
Measure wrist girth at the styloid processes, the bony bumps on the sides of the wrist. Use a flexible tape placed snugly but not compressing the skin. The landmark is the same for every person. Inter-observer error for wrist girth in trained anthropometrists runs 2 to 4 millimetres. In untrained self-measurement, the error can exceed 1 centimetre because the tape lands at the wrong height or tension. The 1983 Metropolitan Life height-weight tables used wrist girth as a proxy for frame size to define three categories: small, medium, large. Those tables were built from insurance policy data on a specific mid-20th-century US population, not from a random sample of the general public.
Elbow Width Assessment
Elbow width uses a sliding calliper to measure the distance between the medial and lateral epicondyles of the humerus, the two bony prominences on either side of the elbow joint. Bend the arm at 90 degrees with the palm facing up. Place the calliper on the widest part of the elbow. This reading is more reliable than wrist girth because the bony landmarks are easier to locate. Published inter-observer error for elbow width is 1 to 3 millimetres in trained hands. The most widely cited reference tables are the Frisancho 1990 elbow width tables, which give frame size categories by sex and height using data from the NHANES anthropometric reference data. These tables classify a man of a given height with an elbow width of 6.5 centimetres as small-framed, 7.0 to 7.5 centimetres as medium, and 8.0 centimetres or above as large. For a woman of a given height, an elbow width of 5.5 centimetres is small, 6.0 to 6.5 centimetres is medium, and 7.0 centimetres or above is large.
Biacromial and Bitrochanteric Span
Biacromial span, the width across the shoulders measured between the acromion processes, and bitrochanteric span, the width across the hips measured between the greater trochanters, appear in research settings but not in routine frame size classification. They require a beam calliper and a supine subject. The equipment is not available in most clinical or gym settings. The Hurd 1980 frame size equations combine wrist girth, elbow width, biacromial span, and bitrochanteric span into a single index. They exist only in the research literature and are not used in practice for BMI adjustment. The complexity of the equations and the need for specialised instruments mean that no major health organisation has adopted them for population screening.
How Much of BMI Variation Does Skeletal Frame Size Actually Explain
The correlation coefficient between a composite frame size score and BMI in an adult population of the same height sits between 0.15 and 0.25. That means skeletal frame size explains roughly 2 to 6 percent of the variation in BMI between individuals. The remaining 94 to 98 percent comes from differences in lean body mass, fat mass, and hydration.
Bone mineral density contributes to this small fraction. A DXA bone mass reading can quantify the proportion of total body weight that is skeletal tissue. In a typical adult, the skeleton accounts for 12 to 15 percent of total body weight. The range across individuals is about 8 to 20 percent. A large-framed person may have 3 to 5 kilograms more bone mass than a small-framed person of the same height. That is a real difference. It is not large enough to shift a person from the normal BMI range into the overweight range, or from overweight into obesity. A person with a BMI of 27.0 and a very large frame might have a BMI of 26.5 if their bone mass were removed from the calculation. That does not move them below the overweight threshold at 24.9.
The confusion comes from the three-compartment model of body composition, which divides body weight into fat mass, lean mass (muscle, organs, fluid), and bone mass. When someone says they have a large frame, they often mean they have a muscular build, not a heavy skeleton. Muscularity is the far larger contributor to a higher BMI in someone who is not overfat. A trained athlete with 20 kilograms of additional lean body mass will have a BMI elevated by 5 to 7 units compared with a sedentary person of the same height, regardless of frame size. Frame size cannot explain that difference.
| Table Source | Measurement Used | Population the Table Was Built From | Number of Frame Size Categories | Notable Limitation |
|---|---|---|---|---|
| Metropolitan Life height-weight tables (1983) | Wrist girth | US life insurance policyholders, predominantly white, mid-20th century | Three (small, medium, large) | Not a random sample; excludes people who could not obtain or afford insurance |
| Frisancho elbow width tables (1990) | Elbow width (biepicondylar breadth) | NHANES I and II (1970s–1980s), US civilian non-institutionalised population | Three (small, medium, large) by sex and height | NHANES data are now 35 to 50 years old; body composition in the US population has shifted since |
| Hurd frame size equations (1980) | Wrist girth, elbow width, biacromial span, bitrochanteric span | Small research sample, not population-representative | Continuous index, not categorical | Too complex for clinical use; no major health body has adopted the equations |
Frame Size Body Weight Adjustment: What the Numbers Allow and What They Do Not
The bone structure effect on BMI accuracy is largest in the normal BMI range and shrinks as BMI moves higher. A person with a BMI of 22.0 and a very small frame might be carrying a higher percentage of body fat than their BMI suggests, because their total weight includes less skeleton and less lean mass. A person with a BMI of 22.0 and a very large frame might be leaner than their BMI implies. But these are edge cases. Frame size adjustment fine-tunes an estimate of a weight that carries lower risk. It does not explain away a BMI in the overweight or obese range.
Why Frame Size Matters Less Above BMI 25
In the overweight range (BMI 25 to 29.9) and above, the contribution of bone mass to total body weight becomes proportionally smaller. The majority of the excess weight is fat or lean tissue. Body composition measurement (DXA, BIA, skinfold) is required to distinguish between those two. Frame size alone cannot tell you whether the extra weight is muscle, fat, or fluid. A person with a BMI of 28.0, a large frame, and 30 percent body fat by DXA is at higher cardiometabolic risk than a person with the same BMI, the same frame size, and 18 percent body fat. The frame size explains the same amount of the weight in both cases. The risk profile is entirely different.
The Self-Reported Frame Size Problem
Self-reported frame size introduces a separate error. When people classify themselves as small, medium, or large framed without taking any measurement, the agreement with measured frame size is poor. In population surveys, roughly 40 to 50 percent of individuals misclassify their own frame size. They call themselves medium when they are actually small or large. This error compounds the misclassification problem: if you adjust a weight target using a frame size you guessed wrong, the adjustment moves in the wrong direction.
The One Thing That Most Often Goes Wrong With Frame Size and BMI
The single most common mistake is using frame size to dismiss a high BMI as an artifact of bone structure without ever measuring the frame. A person who says they have a large frame often has never had their elbow width or wrist girth measured against a reference table. The same person may have a BMI of 28.0 and a body fat percentage of 32 percent by DXA. That puts them in the overfat category regardless of frame size. Frame size does not explain away BMI misclassification in the overweight range. If you are at BMI 27 or above and concerned about health risk, the next step is body composition measurement, not a frame size argument.
Book a DXA Scan to Know for Certain
A DXA scan or a skinfold measurement by a trained technician will tell you whether the excess weight is muscle or fat. Book a DXA scan at a university exercise physiology lab or a medical imaging centre that offers it. Ask for the fat mass, lean mass, and bone mass numbers. If bone mass is at the high end of the normal range and fat mass is also high, the frame size is not the explanation. If bone mass is high and fat mass is in the healthy range for your sex and age, the frame size is contributing meaningfully to the scale weight. That is the only way to know.
Common Questions
How much weight difference does skeletal frame size actually make?
At the same height, the difference in total body weight between a very small-framed person and a very large-framed person is 3 to 5 kilograms, or about 1 to 2 BMI units. That is a real difference. It is not large enough to shift a person out of a WHO BMI category in most cases. A person with a BMI of 26.0 and a large frame might have a BMI of 24.5 if their skeleton were lighter, still within the normal range but very close to the overweight threshold.
Can I rely on my doctor's assessment of my frame size?
Only if they measure it with a tape or calliper. Most clinical assessments of frame size are based on visual inspection or a patient's self-report. Visual classification of frame size has high inter-observer error. Two clinicians looking at the same person often disagree. If frame size is used to adjust a weight recommendation, ask to see the measurement and the table it came from.
Does frame size explain why some normal-weight people have high body fat?
Partly, but not primarily. Normal-weight obesity, a BMI below 25 with body fat percentage above 30 in women or 25 in men, is more strongly associated with low muscle mass than with skeletal frame size. A small-framed person with low muscle mass will have a lower total weight at the same height, so they can have a normal BMI while carrying a high proportion of fat. Frame size contributes. Muscle mass is the bigger factor.
Should I use a frame size adjustment when calculating my calorie needs?
No. BMR equations like the Mifflin-St Jeor equation already account for total body weight, which includes bone mass. Adding a frame size multiplier would double-count the skeleton. For a more personalised BMR estimate, use a lean mass measurement from DXA or BIA, not a frame size category. The BMR estimation equations carry individual errors of 10 to 20 percent regardless of frame size. Frame size is not a source of that error that needs correcting.
Why do some online calculators ask for wrist girth?
They use a simplified version of the Metropolitan Life height-weight table method to estimate a weight range. That method is over 40 years old and was built from a non-representative sample. The wrist girth measurement is quick and easy, but the resulting weight range has no evidence base for modern populations. Book a DXA-based body composition assessment if you want a personalised target. Otherwise, the WHO BMI range of 18.5 to 24.9 is the best available population-level guideline.