Waist-to-Height Ratio: What the NICE 0.5 Rule Means and How to Measure Correctly
The NICE CG189 (2022) guideline advises keeping waist-to-height ratio below 0.5. Learn what this ratio predicts, how it differs from BMI, and the correct waist measurement protocol with its error margins.
Waist-to-Height Ratio: What the NICE 0.5 Rule Means and How to Measure Correctly
Keep your waist to less than half your height. That is the waist-to-height ratio 0.5 rule, published by the UK National Institute for Health and Care Excellence in guideline CG189 (2022). It is a population-level health signal, not a personalised risk score. A single dimensionless cut-off of 0.5 removes the need for sex-specific boundaries because it scales waist size to stature. The rule works because it adjusts for frame size and body height in one number.

NICE CG189 Waist-Height Threshold: What the Guideline Says
NICE CG189, updated in 2023, recommends waist-to-height ratio as a central adiposity marker alongside BMI. The guideline sets two boundaries. A ratio of 0.5 or higher indicates increased central adiposity risk. A ratio of 0.6 or higher marks further increased risk. The evidence base comes from a systematic review of 20 studies covering approximately 300,000 adults. The NHS adopted the 0.5 rule on its website in 2023, making it the standard advice for the UK population.
The NICE guideline does not claim the 0.5 boundary is a diagnostic tool. It is a screening heuristic for cardiometabolic risk. A person above 0.5 should have further assessment, not a label. The guideline states that waist-to-height ratio should be used alongside, not instead of, BMI. The 0.5 rule works at the population scale because it captures the same central adiposity signal that waist circumference cut-offs from the WHO and NIH/NHLBI aim to catch, but with a single number that adjusts for height.
How to Measure Waist Circumference Correctly
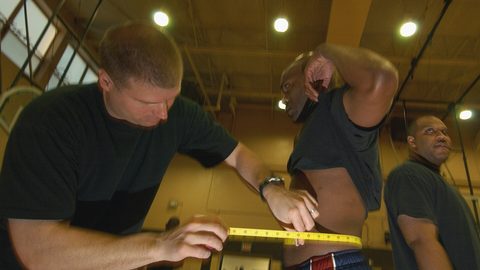
Book an appointment with a trained observer. Measuring waist circumference correctly requires a protocol. The landmark is the midpoint between the lowest rib and the iliac crest. The measurer places a flexible, non-stretch tape at that midpoint, keeps tension snug but not compressing the skin, and takes the reading at the end of a normal expiration. The measurement is recorded to the nearest 0.1 cm or 0.5 cm depending on the tape.
Why The Protocol Matters
Measurement error is substantial. Intra-observer error, the same person measuring twice, is 0.5 to 1.5 cm. Inter-observer error, two different trained people measuring the same person, ranges from 1.0 to 2.5 cm. For an average-height adult, an error of 1 cm shifts the waist-to-height ratio by roughly 0.01. An error of 2.5 cm shifts it by 0.02. That is the difference between a ratio of 0.49 and 0.51, the difference between being below the 0.5 rule and above it.
Self-Measurement Is Unreliable
Do not measure yourself. Self-measured waist circumference is unreliable. Errors exceed 3 to 5 cm, and the direction of error depends on landmark misunderstanding. A person who measures at the narrowest point of the torso instead of the midpoint between rib and iliac crest will get a smaller number. A person who measures over clothing or at the navel will get a larger number. The error from self-measurement shifts the waist-to-height ratio by 0.02 to 0.04, enough to misclassify a person into a higher or lower risk category. Verweij et al. (2013) documents that self-measured waist circumference is not equivalent to a protocol-adherent measurement. If you cannot have a trained observer take the measurement, treat your self-measured number as an estimate, not a fact.
Waist-to-Height Ratio vs BMI: Why WHtR Adds Information
BMI is a weight-to-height ratio. Waist-to-height ratio is a circumference-to-height ratio. They measure different things. BMI captures total body mass relative to height. It cannot distinguish fat from lean tissue or central from peripheral fat storage. Waist-to-height ratio captures abdominal fat distribution, which is independently associated with metabolic disease risk.
The predictive power difference is consistent across meta-analyses. The 2012 Ashwell meta-analysis of 31 studies covering approximately 300,000 adults found waist-to-height ratio had an area under the receiver operating characteristic curve (AUROC) of 0.68 to 0.72 for cardiometabolic outcomes. BMI had an AUROC of 0.62 to 0.66. The difference of 0.04 to 0.06 in AUROC means WHtR correctly classifies more people than BMI when predicting diabetes and cardiovascular risk factors. The 2008 Lee meta-analysis of 23 studies covering roughly 250,000 adults confirmed that indices of abdominal obesity, including WHtR, are better discriminators of cardiovascular risk factors than BMI.
The advantage of WHtR over BMI is largest in populations where BMI misclassifies risk. Older adults lose lean mass while maintaining or gaining fat, so a normal BMI can mask excess abdominal fat. Certain ethnic groups, particularly South Asian and Chinese populations, develop cardiometabolic complications at lower BMI levels. The WHO Asian BMI cut-offs (overweight at 23 kg/m², obesity at 27.5 kg/m²) were introduced in 2004 precisely because the standard cut-offs missed elevated risk in these groups. WHtR with the 0.5 rule does not need separate boundaries for different populations. The ratio adjusts for height automatically, and the 0.5 boundary appears to work across multiple ethnicities based on the 31-study meta-analysis.
Central Adiposity Screening: What the 0.5 Rule Predicts
Central adiposity means fat stored around the abdomen, particularly visceral adipose tissue inside the abdominal cavity around organs. Visceral fat is independently associated with metabolic disease risk, including type 2 diabetes, cardiovascular disease, and non-alcoholic fatty liver disease. Waist circumference and waist-to-height ratio are surrogate markers for central adiposity. They cannot distinguish subcutaneous fat from visceral fat. That requires CT or MRI. But they capture enough of the signal to serve as screening tools.
The 2013 Carmienke meta-analysis of 24 studies covering approximately 400,000 adults found that each 0.1 increase in waist-to-height ratio was associated with a 14 percent increase in all-cause mortality risk (hazard ratio 1.14, 95% confidence interval 1.08 to 1.20). That association holds after adjusting for BMI, meaning WHtR captures mortality risk that BMI alone misses. The mortality association is one reason NICE, the WHO, and the International Diabetes Federation all include some measure of central adiposity in their metabolic risk screening guidance.
Understanding the Waist Circumference Cut-Offs From Different Bodies
Different health bodies have published different waist circumference cut-offs, and they are not interchangeable. The WHO, NIH/NHLBI, and IDF each recommend boundaries based on different populations and measurement protocols. Knowing which boundary applies to which population prevents misclassification.
WHO Waist Circumference Boundaries
The WHO Technical Report Series 894 (2000) set cut-offs for Caucasian populations. For men, increased metabolic risk starts at 94 cm, substantially increased risk at 102 cm. For women, increased risk starts at 80 cm, substantially increased risk at 88 cm. The WHO Asian consultation (2004) lowered the increased-risk boundary for men to 90 cm and kept 80 cm for women. These were derived from epidemiological data on cardiometabolic risk and are used globally.
NIH/NHLBI Boundaries
The US National Institutes of Health and National Heart, Lung, and Blood Institute published cut-offs in 1998. High-risk for men is above 102 cm (40 inches). High-risk for women is above 88 cm (35 inches). These were derived primarily from white US populations and may not apply to other ethnic groups without adjustment.
International Diabetes Federation Boundaries
The IDF metabolic syndrome definition (2005) set Europid boundaries at 94 cm for men and 80 cm for women. For South Asian, Chinese, and Japanese populations, the IDF recommends 90 cm for men and 80 cm for women. These are used when diagnosing metabolic syndrome, not just checking for central adiposity.
The waist-to-height ratio 0.5 rule sidesteps this proliferation of cut-offs by using a single dimensionless number. It does not replace the existing boundaries for clinical diagnosis but serves as a simpler population screening rule that works across ethnic groups.
Measurement Error: Why Your Waist Number Might Be Wrong
Measurement error is the biggest practical problem with waist circumference and waist-to-height ratio. The same person measured twice by the same observer can differ by 0.5 to 1.5 cm. Two different trained observers measuring the same person can differ by 1.0 to 2.5 cm. These errors come from three sources.
First, landmark identification. The WHO protocol uses the midpoint between the lowest rib and the iliac crest. The NIH/NHLBI protocol uses the superior border of the iliac crest. The difference between these two sites is 1 to 3 cm. If a person uses the navel instead of either protocol site, the error is larger. Mason and Katzmarzyk (2009) documented that measurement site variation alone shifts the prevalence of metabolic syndrome classification by a meaningful margin.
Second, tape tension. A tape pulled too tight compresses soft tissue and produces a smaller reading. A tape left too loose adds subcutaneous fat and produces a larger reading. The difference between correct tension and incorrect tension is 0.5 to 1.0 cm even for trained measurers.
Third, respiration phase. The measurement must be taken at the end of a normal expiration. Measuring at full inhale adds 1 to 3 cm depending on the person. Measuring at forced exhale or at a pause between breaths adds variation. The standardised protocol specifies end-tidal expiration to control this.
The practical consequence: a waist-to-height ratio of 0.49 measured by a trained observer could be 0.51 if measured by a different trained observer, or 0.53 if self-measured. Do not treat a single measurement as a precise fact. Book a trained observer. If your self-measured ratio is near 0.5, assume you are above the boundary and seek the further assessment the guideline recommends.
The Single Thing That Most Often Goes Wrong With the 0.5 Rule
The most common failure is treating the 0.5 rule as a personal health verdict rather than a population screening heuristic. A person who measures their waist, finds their ratio is 0.51, and concludes they are unhealthy has misused the tool. The waist-to-height ratio is a screening arithmetic, not a diagnostic. It identifies people who may need further assessment. It does not measure body fat percentage, visceral fat area, or metabolic health. The Ashwell meta-analysis and the NICE evidence review are clear: the 0.5 rule is a better screening tool than BMI alone, but it is still a screening tool. If your ratio is above 0.5, book a clinical assessment. Do not assume you have a disease.
The other common failure is using the wrong measurement protocol. The landmark, tape tension, and respiration phase matter. A person who measures at the navel instead of the midpoint between rib and iliac crest, or who takes the measurement at full inhale, will get a number that is not comparable to the boundary used in the research. The error of 1 to 3 cm from protocol variation is large enough to shift the ratio by 0.01 to 0.02. If you are going to use the 0.5 rule, have a trained person take the measurement.
Have a trained observer measure your waist circumference using the WHO protocol, divide by your height, and compare to 0.5. That is the only way to get a number that matches what the research predicts.
Frequently Asked Questions About the Waist-to-Height 0.5 Rule
What does a waist-to-height ratio of 0.5 mean exactly?
A waist-to-height ratio of 0.5 means your waist circumference is exactly half your height. NICE CG189 advises keeping your waist-to-height ratio below 0.5 as a population-level health signal. Above 0.5 indicates increased central adiposity risk. Above 0.6 indicates further increased risk. The ratio is dimensionless, meaning the same boundary applies regardless of your height.
Is the 0.5 rule the same for men and women?
Yes. The 0.5 boundary is not sex-specific. That is the advantage of scaling waist circumference to height. The traditional waist circumference cut-offs from WHO and NIH/NHLBI are sex-specific (94/102 cm for men, 80/88 cm for women). The waist-to-height ratio removes the need for separate boundaries because it adjusts for frame size through height.
How do I measure my waist for the 0.5 rule?
Book a trained observer who uses the WHO protocol: find the midpoint between your lowest rib and your iliac crest. Place a flexible, non-stretch tape at that point. Keep tension snug but not compressing the skin. Take the measurement at the end of a normal expiration. Read to the nearest 0.1 cm or 0.5 cm. Divide your waist circumference in centimetres by your height in centimetres. That is your waist-to-height ratio.
Can I use the 0.5 rule instead of BMI?
NICE recommends using waist-to-height ratio alongside BMI, not instead of it. The two metrics capture different risks. BMI captures total body mass relative to height. Waist-to-height ratio captures abdominal fat distribution. Together they provide a more complete screening picture. A person with a normal BMI but a waist-to-height ratio above 0.5 has central adiposity that BMI alone would miss.
Is the 0.5 rule accurate for all ethnic groups?
The 0.5 boundary was derived from a meta-analysis of 31 studies covering approximately 300,000 adults across multiple ethnicities. It appears to work across populations without needing separate boundaries. This is an advantage over the WHO and NIH/NHLBI waist circumference cut-offs, which were derived primarily from Caucasian populations and required adjustments for Asian populations.
What if my waist-to-height ratio is above 0.5?
A ratio above 0.5 is a screening signal, not a diagnosis. It means you have increased central adiposity risk and should have further assessment. The NICE guideline recommends measuring waist-to-height ratio alongside BMI and using both to identify people who need clinical evaluation. Consult a registered dietitian or clinical exercise physiologist for individualised advice.
Why is self-measured waist circumference unreliable?
Self-measurement errors exceed 3 to 5 cm because of landmark misunderstanding, incorrect tape tension, and not using the correct respiration phase. The measurement error of self-reported waist circumference is documented in the Verweij et al. (2013) systematic review. A self-measured waist-to-height ratio can be off by 0.02 to 0.04, enough to shift a ratio of 0.49 to 0.52 or vice versa. If you cannot have a trained observer measure, treat your self-measured number as an estimate.