Body Composition: Measuring Fat, Muscle and Fat Distribution Beyond BMI
BMI measures weight-for-height, not body composition. This hub routes you to guides on waist-to-height ratio, body fat percentage, visceral fat, and muscle mass, with every threshold attributed to its source.
Body Composition: Measuring Fat, Muscle and Fat Distribution Beyond BMI
BMI divides weight by height and tells you nothing about how much of that weight is fat, where the fat sits, or whether the weight is muscle. The question a body composition measurement answers is the one BMI was never designed for: what is your body actually made of. This guide routes you to the right measurement for what you want to know. Waist-to-height ratio if you are worried about central adiposity risk. Total body fat if you want a full picture. Visceral fat measurement if you care about organ-surrounding fat. Muscle mass if you are the athlete whose BMI says 'overweight' for the wrong reason. Every threshold here is attributed to the body that issued it and the year it was published. Every method is described with its measurement error before any number is interpreted.
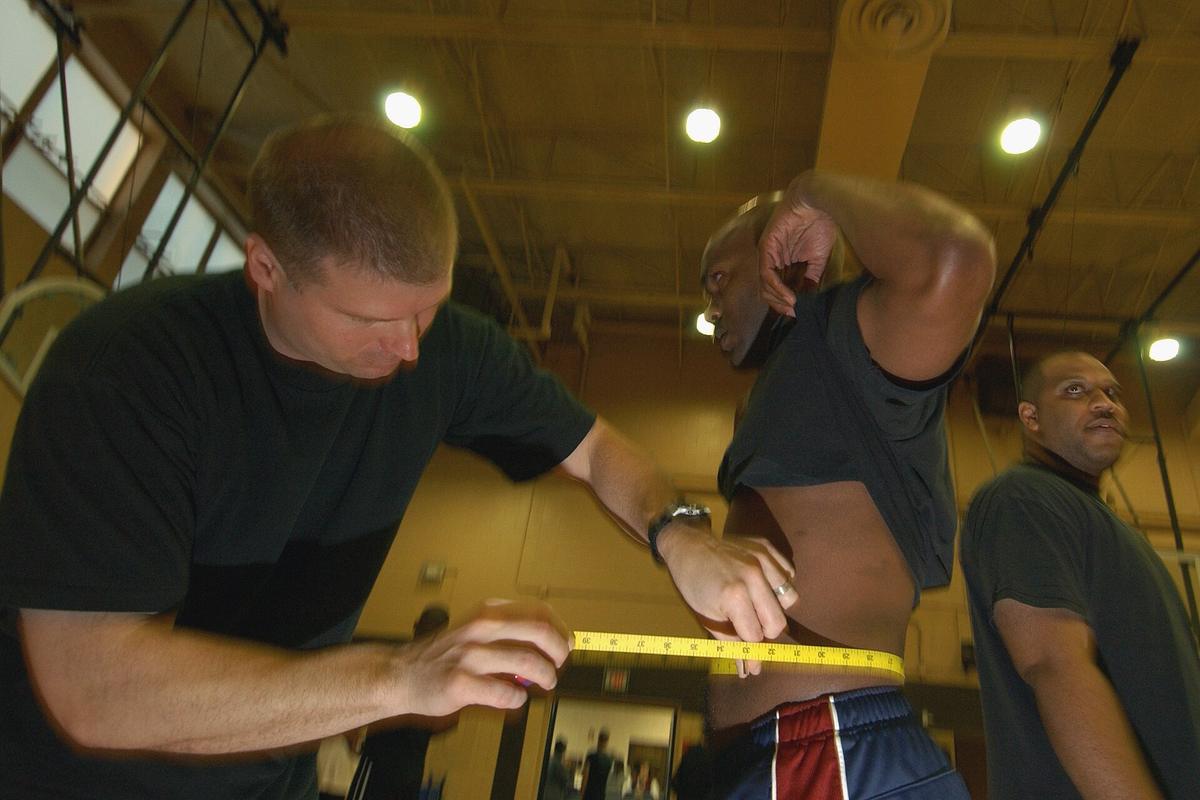
_Lieutenant_(LT)_Jason_Wood,_Physical_Training_Leader_(PTL),_347th_Communications_Squadron_(CS),_Moody_Air_Force_Base_(AFB),_Georgia_(GA),_measures_the_waist_of_a_-_DPLA_-_cf4b437ae7a07ff4e2f83e8647b3c22b.jpeg)
- BMI Cannot Measure: Body fat, muscle mass, fat distribution, or visceral adipose tissue. It is a weight-for-height ratio, not a body composition measurement method.
- WHO Adult BMI Cut-Offs (2000): Underweight <18.5, Normal 18.5-24.9, Overweight ≥25.0, Obese Class I 30.0-34.9, Class II 35.0-39.9, Class III ≥40.0 kg/m². Source: WHO Technical Report Series 894.
- NICE Waist-to-Height Threshold (2014/2022): Keep waist-to-height ratio below 0.5 for adults with BMI <35 kg/m². Source: NICE guideline CG189.
- NIH/NHLBI Waist Risk (1998): High risk: >102 cm (40 in) for men, >88 cm (35 in) for women. Derived from white populations.
- BIA vs DXA Error: Bioelectrical impedance analysis body fat error: ±3-8 percentage points versus dual-energy X-ray absorptiometry, depending on hydration and device. DXA error: ±1-2% versus a 4-compartment model.
Why BMI Is Not a Body Composition Measurement Method
The body mass index is screening arithmetic at population scale, not a diagnostic for an individual body. It divides weight in kilograms by height in metres squared and sorts adults into bands fixed by a World Health Organization committee in the 1990s using epidemiological cut-points, not physiological thresholds. The WHO adult BMI classification was published in its 2000 report Obesity: preventing and managing the global epidemic (Technical Report Series 894). The evidence base was drawn primarily from European-origin populations. Treating a BMI number as a direct readout of metabolic health or body fatness for a specific person is a mistake. It was designed to spot statistical shifts in large groups.
Self-reported height and weight systematically bias BMI downward by roughly 0.5-1.5 kg/m² in adults, as documented in a systematic review of 64 studies by Connor Gorber et al. (2007). The gap is larger in women, older adults, and individuals in higher BMI ranges. This self-report error means even the crude screening power of BMI is further degraded when the numbers are self-supplied. For the individual, two numbers matter far more: your waist relative to your height, and your body fat measured by a method you can trust.
Waist-to-Height Ratio Guide: The Central Adiposity Marker
How To Measure And Interpret The Ratio
The waist-to-height ratio is the most direct single measurement for central adiposity risk. Measure your waist circumference at its narrowest point, or midway between the lowest rib and the iliac crest if the narrowest point is hard to identify. Divide that number by your height in the same units. The UK National Institute for Health and Care Excellence, in its guideline CG189 published in 2014 and updated in 2022, advises keeping the result below 0.5 for adults with a BMI under 35 kg/m². The 0.5 rule is a population-level health signal, not a personalised risk score. The evidence behind it comes from a systematic review and meta-analysis by Ashwell et al. (2012), covering 31 studies and roughly 300,000 adults across multiple ethnicities. They found that a ratio above 0.5 was associated with elevated cardiometabolic risk and was superior to BMI for detecting central adiposity.
Why Stature-Adjusted Waist Beats A Single Cut-Off
The advantage of waist-to-height ratio over the NIH/NHLBI waist circumference thresholds (1998: >102 cm for men, >88 cm for women) is that it adjusts for stature. A tall man with a large waist and a short man with the same large waist carry very different risk. The ratio captures that. The NIH/NHLBI thresholds themselves were derived from prospective cohort studies in white populations and should not be applied without adjustment to other ethnic groups. The International Diabetes Federation, in its 2006 metabolic syndrome definition, used lower waist thresholds: ≥94 cm for Europid men and ≥80 cm for Europid women, and a different set for South Asian men (≥90 cm) and Japanese men (≥85 cm).
Getting A Reliable Tape Measurement
Do not use a tape measure you have just bought without checking its calibration against a metal ruler. Self-measured waist circumference carries an inter-observer error of 3-5 cm or more, as documented by Verweij et al. (2013). A trained observer, using the iliac crest landmark and measuring at the end of a normal exhalation, produces an inter-observer error of 1.5-2.5 cm. If you cannot get a trained measurement, take three measures yourself and use the median.
Body Fat Ranges: Total Adiposity
Body fat is the fraction of your total body mass that is adipose tissue. Unlike waist-to-height ratio, it captures fat stored all over the body, not just in the abdomen. There is no universal healthy-range standard that applies across all measurement methods and populations. The American Council on Exercise published a widely cited classification in 2009, based on expert consensus rather than a single outcome study tracking morbidity or mortality. The ranges for men: essential fat 2-5%, athletes 6-13%, fitness 14-17%, acceptable 18-24%, and above 25%. For women the same categories run higher, reflecting physiological differences in essential fat stores. These numbers are consensus, not law.
The measurement method changes what the number means. Dual-energy X-ray absorptiometry, the reference method in research, has an error of ±1-2% compared with a 4-compartment model (Toombs et al., 2012), but the error varies by manufacturer (GE Lunar versus Hologic) and software version. Bioelectrical impedance analysis, which passes a small current through the body, has an individual error in the range of ±3-8 percentage points compared with DXA (Kyle et al., 2004). The error depends on hydration status, recent food intake, exercise, and the specific device algorithm. A consumer smart scale using BIA may report a body fat number that differs from a DXA reading by 5 percentage points or more. Skinfold measurement using callipers has an error of ±3-5% compared with DXA, with an inter-tester error that can reach ±5% depending on the equation chosen and the skill of the technician (Jackson & Pollock, 1978; Durnin & Womersley, 1974).
| Method | Body Fat Error vs Criterion | What It Measures | Key Limitation |
|---|---|---|---|
| Dual-Energy X-Ray Absorptiometry | ±1–2% vs 4-compartment model | Fat, lean, bone mass | Varies by manufacturer and subject thickness |
| Bioelectrical Impedance Analysis | ±3–8% vs DXA | Total body water estimate of fat | Hydration and algorithm sensitivity |
| Skinfold Callipers | ±3–5% vs DXA; inter-tester up to ±5% | Subcutaneous fat at defined sites | Technician skill and prediction equation |
| Hydrostatic Weighing | ±2–3% vs 4-compartment model | Body density | Unavailable outside research settings |
| BodPod (Air Displacement) | ±2–4% vs 4-compartment model | Body density | Subject movement and clothing artifacts |
DXA vs BIA Accuracy: Which Method to Trust
Choosing between a DXA scan and a BIA device for tracking body fat over time comes down to what you can control. DXA is the reference method: it distinguishes fat mass, lean mass, and bone mineral content using two X-ray beams of different energies. The error against a 4-compartment model is ±1-2%. Book a scan on the same machine each time. BIA estimates body composition by measuring the resistance to a small electrical current, which varies with water content. A single uncontrolled reading, after a meal, after exercise, at a different time of day, can shift the reported figure by several points. For tracking change over time, DXA offers far better precision if you use the same scanner and protocol. BIA is cheaper and faster, but its ±3-8 percentage-point error against DXA means the number it gives you is a rough band, not a precise measurement.
Visceral Fat Measurement: What Surrounds Your Organs
Visceral adipose tissue is the fat stored inside the abdominal cavity around the liver, pancreas, and intestines. It is independently associated with metabolic disease risk, separate from total body fat or subcutaneous fat. Waist circumference and waist-to-height ratio cannot distinguish visceral from subcutaneous fat. Both are markers of total abdominal adiposity. The only methods that measure visceral fat directly are CT and MRI. The widely cited threshold of ≥130 cm² on a single CT slice at the L4-L5 level, associated with elevated metabolic risk, comes from research by Després and Lamarche (1998) and Nicklas et al. (2004). DXA and BIA can estimate visceral fat using algorithms, but those estimates are indirect and carry additional error. Do not trust a consumer device that claims to report your visceral fat number unless it has been validated against MRI or CT in your population group.
Muscle Mass: The Athlete Problem and Other BMI Failures
BMI overestimates adiposity in athletes because it cannot distinguish lean mass from fat mass. A rugby player with a BMI of 28 kg/m² and 10% body fat is classified as overweight by the WHO system, yet has no excess adiposity. Conversely, BMI underestimates adiposity in older adults due to sarcopenia. The loss of muscle mass with age means a person can have a normal BMI but a high body fat. A meta-analysis of 32 studies by Winter et al. (2014) found that the optimal mortality BMI in older adults shifts to 23-30 kg/m², well above the standard WHO normal range.
When Standard Thresholds Misclassify Risk
For any individual whose body composition is unusual, athletes, older adults, bodybuilders, body fat measured by DXA or skinfolds is far more informative than BMI. The same applies to populations for whom standard BMI thresholds misclassify risk. South Asian populations show elevated metabolic risk at BMI 21-25 kg/m², as documented by the WHO expert consultation in 2004. Use the WHO Asian BMI public-health action points instead: 23.0-27.4 kg/m² increased risk, ≥27.5 kg/m² high risk. Black populations tend to have lower body fat at equivalent BMI, meaning BMI may underestimate adiposity in Black women (Deurenberg et al., 1998; Heymsfield et al., 2016).
More in Body composition
-
 Body fat percentage and healthy ranges
Body fat percentage ranges differ by sex, age, and measurement method. Learn the published ranges, why a BIA number is not a DXA number, and the error margins that come with every method.
Body fat percentage and healthy ranges
Body fat percentage ranges differ by sex, age, and measurement method. Learn the published ranges, why a BIA number is not a DXA number, and the error margins that come with every method.
-
 Waist circumference and what it means
Waist circumference thresholds differ by issuing body and population. Learn the NIH, WHO, and IDF cut-offs, where the tape goes according to each protocol, and the measurement error you should expect.
Waist circumference and what it means
Waist circumference thresholds differ by issuing body and population. Learn the NIH, WHO, and IDF cut-offs, where the tape goes according to each protocol, and the measurement error you should expect.
-
 Waist-to-height ratio
The NICE CG189 (2022) guideline advises keeping waist-to-height ratio below 0.5. Learn what this ratio predicts, how it differs from BMI, and the correct waist measurement protocol with its error margins.
Waist-to-height ratio
The NICE CG189 (2022) guideline advises keeping waist-to-height ratio below 0.5. Learn what this ratio predicts, how it differs from BMI, and the correct waist measurement protocol with its error margins.
Common Questions
What is the single most useful body composition measurement for most people?
Waist-to-height ratio. A tape measure and 10 seconds of arithmetic tells you if your central adiposity is above the NICE 0.5 threshold. It costs nothing, has known error, and adds information BMI cannot.
How accurate is a smart scale body fat reading?
Not accurate enough to act on. Consumer BIA scales have an error of ±3-8 percentage points versus DXA. Use them to track rough direction of change over weeks, not as a true body fat figure.
Can I measure visceral fat at home?
No. Waist circumference and waist-to-height ratio estimate total abdominal fat but cannot distinguish visceral from subcutaneous. Reliable visceral fat measurement requires CT or MRI in a clinical setting.
Why does the BMI number from my doctor not match how I feel?
BMI is a population screening tool, not a personal health diagnosis. It misclassifies muscular individuals as overweight and older adults with normal weight as healthy despite high body fat. Body fat and fat distribution matter more.
Read next
-
Waist circumference and what it means
Waist circumference thresholds differ by issuing body and population. Learn the NIH, WHO, and IDF cut-offs, where the tape goes according to each protocol, and the measurement error you should expect.
-
Waist-to-height ratio
The NICE CG189 (2022) guideline advises keeping waist-to-height ratio below 0.5. Learn what this ratio predicts, how it differs from BMI, and the correct waist measurement protocol with its error margins.
-
Body fat percentage and healthy ranges
Body fat percentage ranges differ by sex, age, and measurement method. Learn the published ranges, why a BIA number is not a DXA number, and the error margins that come with every method.