What a BMI Calculator Does: The Quetelet Formula, WHO Categories, and Rounding Rules
The formula a BMI calculator runs, where the WHO 1995 classification categories came from, and how rounding during calculation can shift a person across a category boundary.
What a BMI Calculator Actually Runs
A BMI calculator runs one division: weight in kilograms divided by height in metres squared. That is the entire arithmetic. The result is a number that places you into a band defined by a World Health Organization committee in the 1990s. Nothing in the calculation measures body fat, metabolism, or individual health. The topic covered here is bmi calculator formula categories rounding explained, so you know what the calculator does before you type a single digit.
The Formula's Origins
The formula is the Quetelet index, named after Adolphe Quetelet, a 19th-century Belgian statistician. He devised it in 1832 as a way to describe the statistical average man. It was a population-level description, not a health metric. Quetelet wanted to see how body weight scaled with height across groups of people. He was not diagnosing anyone. That origin matters because the tool was built for populations, not individuals. A BMI calculator today still does exactly what his pencil did: weight divided by height squared.
The Formula: Weight-Kg/Height-M² and the Metric-Imperial Switch
The formula is simple but the units cause most of the errors. In metric: weight (kg) / height² (m²). A person who weighs 70 kg and is 1.75 m tall has a BMI of 22.9, 70 divided by 3.0625. In imperial units the formula changes: weight (lb) / height² (in²) × 703. That multiplier exists because the raw ratio of pounds to inches squared produces a different scale. A person at 69 inches tall (5 ft 9 in) calculates weight in pounds divided by 4761, multiplied by 703.
Stones add another conversion step. One stone is 14 lb. Convert stones to pounds first, then apply the 703 multiplier. The BMI metric imperial conversion calculator you find online does exactly these two arithmetic paths, nothing more.
The Quetelet Index: Weight Kg Height M²
Search for Quetelet index weight kg height m2 and you will find historical sources confirming the formula has not changed since 1832. Quetelet published it in his book Sur l'homme et le développement de ses facultés (A Treatise on Man). He collected data on European soldiers and found that weight increased roughly with the square of height in the average man. That was a statistical observation, not a physiological law. The index was renamed body mass index in 1972 by Ancel Keys in a paper titled 'The body mass index: a statistical tool for population studies'. Keys was explicit that it was a screening tool, not a diagnostic.
When you enter weight and height into a calculator, you are running a 190-year-old statistical description of soldiers. That is the provenance. No new science happens inside the box.
WHO Adult BMI Cut-Offs 1995: The Categories and Their Origins
The WHO adult BMI cut-offs 1995 come from a formal expert consultation published as Physical status: the use and interpretation of anthropometry (WHO Technical Report Series 854). That 1995 document set the boundaries that every consumer BMI calculator uses today. They were reaffirmed in 2000 in Obesity: preventing and managing the global epidemic (Series 894). The seven categories are:
- Underweight: below 18.5 kg/m²
- Normal range: 18.5 to 24.9 kg/m²
- Pre-obese (overweight): 25.0 to 29.9 kg/m²
- Obesity class I: 30.0 to 34.9 kg/m²
- Obesity class II: 35.0 to 39.9 kg/m²
- Obesity class III: 40.0 kg/m² and above
These are epidemiological cut-points. The committee looked at observational studies showing inflection points in mortality and morbidity risk at those numbers. Not a single trial. Not a physiological threshold. BMI category boundaries explained means understanding that normal is a statistical band, not a health certificate. The boundary at 25.0 is where risk in European populations began to rise in the data available in the 1990s. It measures nothing about your body composition.
Rounding Error: How Decimal Places Shift the Band
BMI calculator rounding error is a real phenomenon. A calculator that rounds height to one decimal place before squaring introduces a systematic shift. Height measured as 1.75 m is exact; 1.8 m (rounded from 1.75) produces 1.8² = 3.24 instead of 3.0625, lowering the BMI by 0.5 kg/m² for the same weight. A 70 kg person goes from 22.9 to 21.6, still normal, but the shift matters near boundaries. Weight rounding of 0.5 kg shifts BMI by roughly 0.1 to 0.2 kg/m². The combined effect of rounding height to the nearest centimetre and weight to the nearest half-kilogram can shift the final BMI by 0.1 to 0.3 kg/m².
That range can cross a category boundary. A person whose exact BMI is 24.95 (normal range) may be reported as 25.1 (overweight) if height is rounded down and weight up. The opposite rounding can place a 25.05 person into normal. The calculator has no awareness of the boundary; it applies the arithmetic you give it. Use four significant digits in the height square to avoid the problem. A height of 1.75 m squared is 3.0625, not 3.06 and not 3.1.
Self-Reported vs Measured BMI: The Systematic Downward Shift
Self-reported vs measured BMI is not a minor detail. A 2007 systematic review by Connor Gorber and colleagues, published in Obesity Reviews, analysed 64 studies and found that adults systematically under-report weight by 0.5 to 1.5 kg and over-report height by 0.5 to 2.0 cm. The effect on BMI is a downward shift of 0.5 to 1.5 kg/m². That is enough to move a person from the top of normal into normal, or from overweight into normal, depending on where they sit.
The gap is larger in heavier individuals and in women. Self-report is what the doctor's receptionist records and what the fitness app asks for. The number you get back is systematically lower than your measured BMI. If your calculator result says 24.0, your actual measured BMI is likely 24.5 to 25.5. That difference matters when you are evaluating whether you cross the 25.0 boundary. Treat self-reported inputs as a first estimate, not a diagnosis.
BMI as a Population Screening Tool, Not a Diagnostic
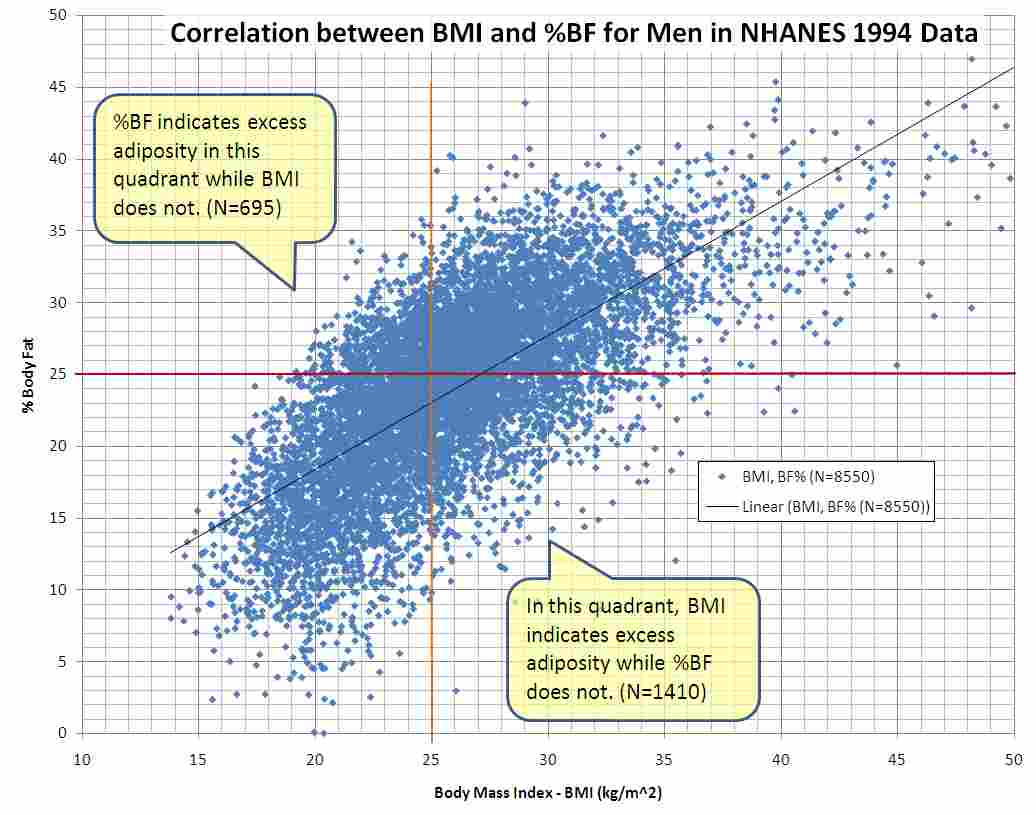
Every major guideline, WHO, CDC, NICE, states that BMI is a screening tool and not a diagnostic. A screening tool sorts groups: it identifies who in a population may need further assessment. It does not tell a specific person whether they have excess body fat, are metabolically healthy, or are at increased disease risk. The failure mode is treating the BMI number as a personal health grade. That is the single most common misunderstanding.
What the Number Misses
The tool measures no fat at all. It measures weight and height. A muscular person can have a BMI of 28 and very low body fat. An older adult can have a BMI of 22 and elevated body fat percentage with low muscle. A person of South Asian descent can have metabolic risk equivalent to a European with a BMI 3 to 6 units higher, meaning a normal 22 may carry risks that a European would not see until 25 to 28. The WHO Asian cut-offs (2004) set an additional public health action threshold at 23.0 and a high-risk threshold at 27.5 for Asian populations, because the evidence shows elevated type 2 diabetes and cardiovascular risk at lower BMI. Those cut-offs are also screening points, not diagnoses.
What BMI Prime Is and Why the Calculation Matters
BMI prime is the ratio of a person's BMI to the upper boundary of the normal range (25.0). A person with BMI 22.9 has a BMI prime of 0.916. A person with BMI 30.0 has a BMI prime of 1.20. The prime is a dimensionless number that makes comparisons across populations easier: a prime above 1.0 means the person is above the normal threshold. It is the same information as BMI itself, normalised to a reference point. Some calculators report it as a percentage, 120% of the normal upper boundary, which can be clearer for screening.
Measurement Error and Uncertainty
The calculation itself is trivial once you have the BMI. The work is in the measurement inputs. Height measurement error 2 cm is common when measuring at home without a stadiometer. Two centimetres on a 1.75 m person changes BMI by about 0.6 kg/m². Weight measurement error 0.5 kg on a home scale shifts BMI by about 0.2 kg/m². Combined, those errors produce an uncertainty band of roughly 0.8 kg/m² around any single measurement. A reported BMI of 24.8 could be anywhere from 24.0 to 25.6, spanning the normal-overweight boundary. The calculator has no way to show that uncertainty. You have to add it yourself.
What the Calculator Cannot Tell You
The calculator cannot tell you whether you are healthy. It can tell you where you sit on a 190-year-old statistical distribution. That distribution was built from 19th-century soldiers and committee decisions in the 1990s. It is a population screening arithmetic, not an individual diagnostic. It sorts groups. It does not diagnose a person. It measures no fat at all. The single thing that most often goes wrong is treating the output as a final answer rather than a starting point for further assessment, a number that needs context, not a verdict that ends the conversation.
More in this guide
Body Measurement Calculators: BMI, TDEE, Body Fat, and Waist Ratio Tools ExplainedHow the US Navy Circumference Method Estimates Body Fat Percentage.
Common Questions
Does a BMI calculator measure body fat?
No. A BMI calculator measures weight and height only. It does not measure body fat percentage, lean mass, or any metabolic marker. Body fat percentage requires a different method, DXA, BIA, skinfold callipers, or hydrostatic weighing, and even those methods have individual errors of ±3 to 8 percentage points.
Can rounding in the calculation push me into the wrong BMI category?
Yes. Rounding height to one decimal place and weight to the nearest kilogram can shift the final BMI by 0.1 to 0.3 kg/m². When your exact BMI is near a boundary, 24.9 or 25.0, 29.9 or 30.0, that rounding can change the band. Use the full squared height to four decimal places to minimise the error.
Are the WHO BMI cut-offs the same for everyone?
No. The standard WHO cut-offs (underweight below 18.5, normal 18.5 to 24.9, overweight 25 to 29.9, obese 30+) were derived from European population data. The WHO Asian cut-offs (2004) set an increased-risk threshold at 23.0 and a high-risk threshold at 27.5 for Asian populations. Several countries, India, Singapore, Japan, have adopted lower thresholds for their populations.
Why does my self-reported BMI differ from a measured one?
Self-reported weight is under-stated by 0.5 to 1.5 kg and self-reported height is over-stated by 0.5 to 2.0 cm, according to a 2007 systematic review of 64 studies. That combination systematically lowers BMI by roughly 0.5 to 1.5 kg/m² in adults. The difference is larger in heavier individuals. If your self-reported BMI is 24.0, your measured BMI is likely 24.5 to 25.5.
Can I use a BMI calculator for a child the same way as for an adult?
No. Children require age- and sex-specific percentiles drawn from growth charts. In the US, clinicians use the CDC 2000 growth charts. In the UK, the NHS uses UK90 growth charts. An absolute BMI of 22 in a 10-year-old does not map to the same category as it does in an adult. You must use a paediatric BMI calculator that references the correct percentile framework.