How the Quetelet Index Became Body Mass Index and a Global Screening Tool
BMI began as Adolphe Quetelet's 19th-century statistical description of the average man. Ancel Keys named it in 1972, and the WHO adopted it as a screening standard in 1995.
The Belgian Statistician Who Accidentally Invented BMI
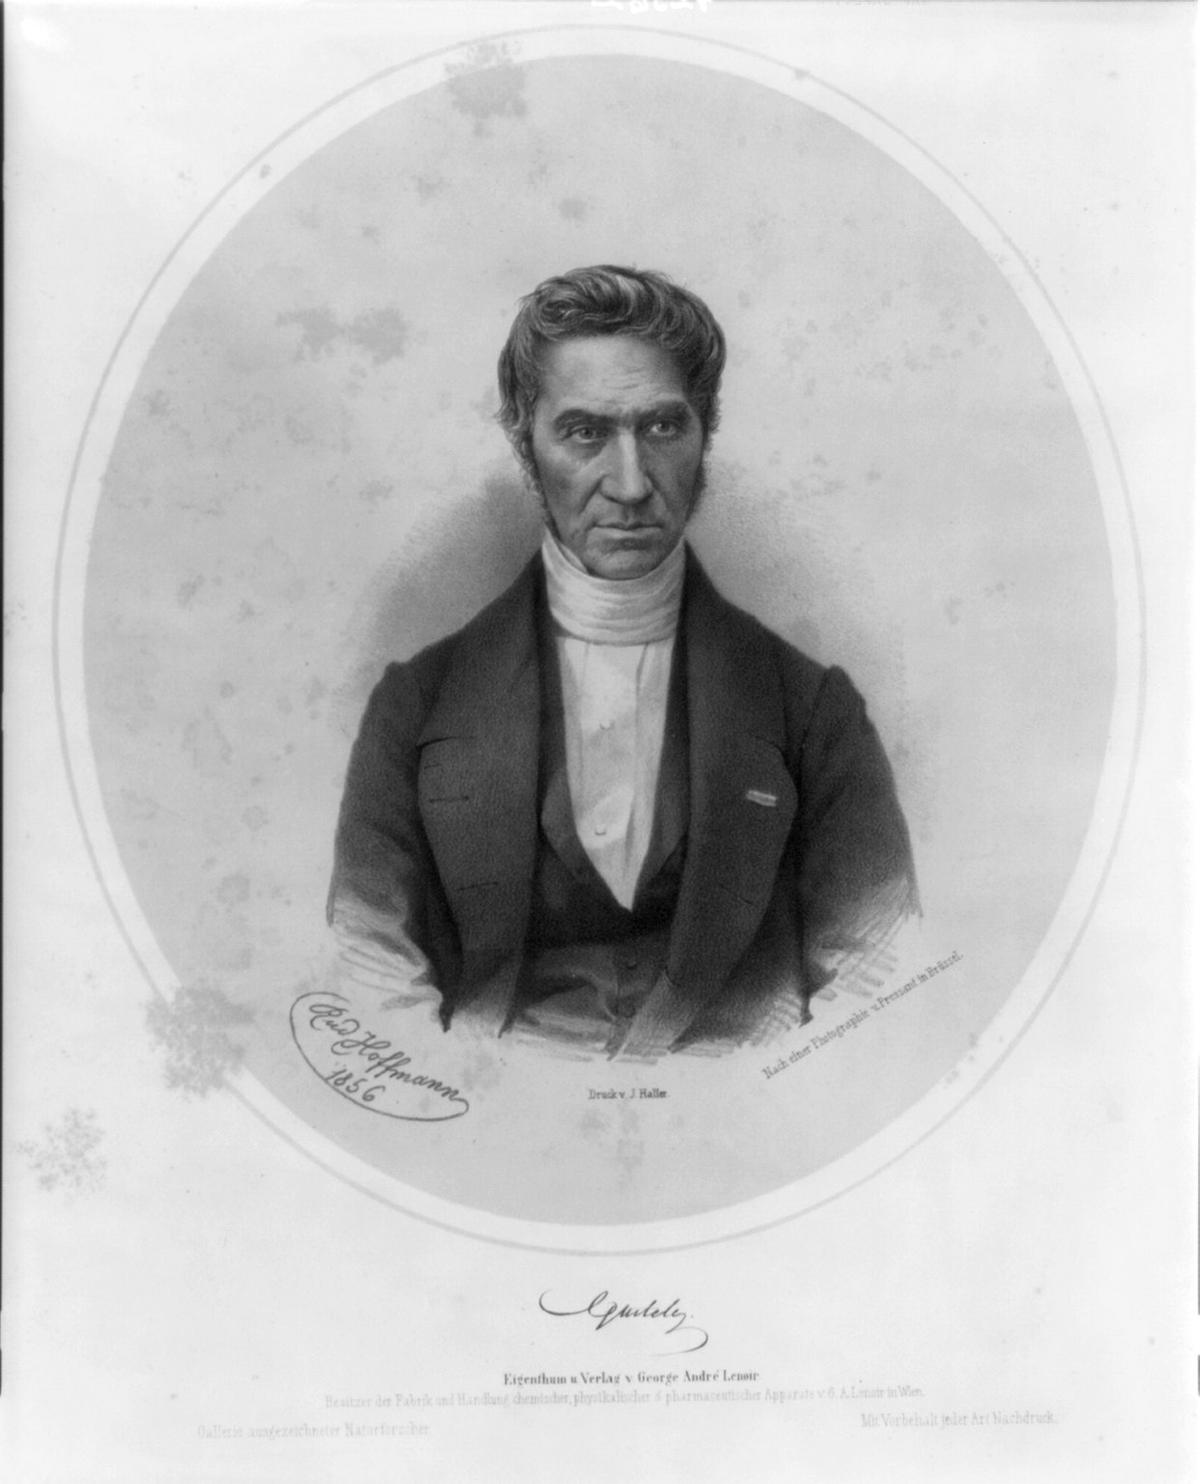
In 1835, Adolphe Quetelet published Sur l'homme et le développement de ses facultés. He was not a doctor, not a dietitian, and not interested in individual health. He was a mathematician and astronomer trying to describe what he called l'homme moyen, the average man, using the same statistical tools he used to map stars. The formula he proposed, weight divided by height squared, was never intended as a health screener. It was a descriptive number for populations, nothing more.
Quetelet's index sat largely unused by medicine for over a century. It was a demographic footnote. Then, in 1972, a physiologist named Ancel Keys dug through seven decades of body-mass formulas and published a paper that changed everything.
Act One: Quetelet and the Average Man (1835-1971)
Adolphe Quetelet was a product of 19th-century social physics, a movement that believed human characteristics, like planetary orbits, obeyed statistical laws. He collected height and weight data from French and Scottish soldiers and civilians and noticed that weight roughly increased with the square of height. He formalised this as the Quetelet index: weight in kilograms divided by height in metres squared.
He called it a 'ponderal index' in some writings, but the formula was the same one we use today. He had zero interest in disease, mortality, or body fat. The Quetelet index was purely descriptive, a single number that summarised the shape of a population, not a diagnostic for any person in it.
For the next 130 years, the index appeared occasionally in actuarial tables and insurance risk assessments. Metropolitan Life Insurance used body-mass tables in the 1940s and 1950s, but they set thresholds by frame size and gender, not by a single arithmetic formula. The Quetelet index was a curiosity, not a standard.
What Was Gained in Act One
A simple, reproducible, dimensionless number that let researchers compare populations. Quetelet's formula required only a scale and a tape measure. No expensive equipment, no clinical expertise. It unified body-mass data into a single metric that could be plotted and averaged.
What Was Lost in Act One
Nothing, because the index had no clinical pretension. It was a descriptive statistic, and nobody yet expected it to be anything else.
Act Two: Ancel Keys and the 1972 Paper That Named BMI
By the 1960s, researchers studying obesity had a problem. They had at least a dozen different body-mass indices: weight/height, weight/height², weight/height³, ponderal index, height/∛weight. No consensus on which one best predicted body fat. In 1972, Ancel Keys and his colleagues published a paper in the Journal of Chronic Diseases (Vol. 25, pp. 329-343) that systematically compared them.
Keys studied 7,424 men from five cohorts: US railroad workers, US middle-aged men, Finnish men, Italian men, and Japanese men. He measured their body fat using skinfold callipers and densitometry, then ran every formula against the fat measurements. The Quetelet index, weight/height², correlated better with body fat than any other. It was not perfect. It was the best of a flawed set.
In that same paper, Keys gave it a new name: 'body mass index.' The term stuck. The 1972 Keys paper is the single most important document in BMI's transformation from a demographic curiosity to a clinical tool.
What Was Gained in Act Two
An evidence base. Keys did not invent BMI; he validated it against real body fat measurements in a large, multi-country sample. He also introduced the idea that a body-mass index could serve as a proxy for adiposity in population studies. That was a conceptual leap: Quetelet described shape; Keys suggested the index could stand in for fatness.
What Was Lost in Act Two
The individual. Keys was careful to say his finding applied to populations. But the paper opened the door for clinicians and public health officials to treat the index as an individual screening tool. The shift from describing groups to sorting individuals had begun, even if Keys did not intend it.
| Study | Year | Population | Key Finding |
|---|---|---|---|
| Quetelet, Sur l'homme | 1835 | French/Scottish soldiers and civilians | Proposed weight/height² as a statistical descriptor of average body shape |
| Keys et al., Journal of Chronic Diseases | 1972 | 7,424 men from five cohorts (US, Finland, Italy, Japan) | Weight/height² correlated best with measured body fat; coined 'body mass index' |
| WHO, Technical Report Series 854 | 1995 | Predominantly European-origin populations | Adopted adult BMI cut-offs (<18.5, 18.5–24.9, 25.0–29.9, ≥30.0) as global screening standard |
Act Three: The WHO Adoption in 1995 That Locked It Into Global Practice
Between Keys' 1972 paper and the mid-1990s, BMI spread through epidemiology and public health. But it had no official cut-offs. Different countries, different studies, and different organisations used different thresholds. The turning point came in 1995 when the World Health Organization published Physical Status: The Use and Interpretation of Anthropometry, WHO Technical Report Series 854.
That document set the now-familiar adult BMI classification: underweight as below 18.5 kg/m², normal range as 18.5 to 24.9 kg/m², overweight as 25.0 kg/m² and above, divided into pre-obese (25.0-29.9), and obese class I (30.0-34.9), class II (35.0-39.9), and class III (40.0 and above). The cut-offs were based on the association between BMI and mortality and morbidity in studies of predominantly European-origin groups.
An Administrative Decision, Not a Medical Breakthrough
The WHO adoption in 1995 was not a medical breakthrough. It was an administrative decision. A committee chose epidemiological cut-points, not physiological thresholds. The numbers were never derived from a direct measure of body fat or metabolic health in individuals. They were population-level risk bands, fixed by consensus, then exported worldwide.
In 2000, WHO refined and reaffirmed those cut-offs in Obesity: Preventing and Managing the Global Epidemic. In 2004, a WHO Western Pacific Region consultation lowered the triggers for Asian groups: additional action recommended at BMI 23.0 kg/m², high risk at 27.5 kg/m², because type 2 diabetes and cardiovascular disease appeared at lower BMI in those groups.
What Was Gained in Act Three
A global standard. Before 1995, a BMI of 27 might be 'overweight' in one country and 'acceptable' in another. After 1995, researchers, clinicians, and policymakers had a common language. International comparisons became possible. Prevalence tracking became systematic.
What Was Lost in Act Three
The gap between the tool and its purpose widened. A statistical index designed to describe populations was now being used to screen individuals. The WHO itself says BMI is a screening tool, not a diagnostic. But in practice, patients receive a number and a label. The cut-offs that were reasonable for group-level risk became personal verdicts. That mismatch is the durable tension that persists today.
The Durable Tension: Population Statistic, Individual Verdict
BMI survived because it is cheap, fast, and reproducible. You can measure it in a clinic, a field survey, or a smartphone app. You do not need a DXA scanner or a trained anthropometrist. That practicality is what made it the global standard.
But the same simplicity that made BMI universal also makes it wrong for many people. BMI misclassifies body fat in muscular individuals. It misclassifies older adults: sarcopenic obesity, where body fat is elevated despite a normal BMI, is common after age 65. And it misclassifies by ethnicity: for the same body fat percentage, BMI runs lower in South Asian, Chinese, and other East Asian groups compared to European-origin groups.
The Prospective Studies Collaboration (2009) analysed 894,576 adults and found the lowest all-cause mortality at BMI 22.5-25.0. The Global BMI Mortality Collaboration (2016) looked at over 10 million adults and found the nadir at BMI 20.0-25.0. Both confirmed that the risk curve is J-shaped or U-shaped, not linear. BMI is a useful summary statistic for groups. It is not a health grade for you.
The One Question This Page Answers
How did BMI go from a 19th-century statistical curiosity to the dominant global screening tool for body weight? Through three deliberate acts: Quetelet described; Keys validated; WHO standardised. Each step gained something, reproducibility, evidence, consensus. Each step lost something: the individual focus, the descriptive humility, the acknowledgement that the tool was never designed for the job it was given.
The most common mistake people make with BMI is treating a screening number as a diagnosis. If your BMI is in the 'overweight' band, it does not tell you your body fat percentage, your waist circumference, your metabolic health, or your risk of disease. It tells you where you sit on a distribution created by a 19th-century astronomer and standardised by a 20th-century committee. That is useful for researchers. It is not a personal verdict.
Common Questions
Who invented BMI and when?
Adolphe Quetelet invented what was then called the Quetelet index in 1835, publishing it in Sur l'homme et le développement de ses facultés. He was a Belgian mathematician and astronomer studying the statistical characteristics of the average man, not a physician studying health.
When was the term 'body mass index' first used?
Ancel Keys coined the term 'body mass index' in a 1972 paper published in the Journal of Chronic Diseases. He tested multiple body-mass formulas against measured body fat in 7,424 men and found Quetelet's index, weight/height², was the best population predictor.
When did the WHO adopt BMI cut-offs?
The World Health Organization adopted the standard adult BMI cut-offs in 1995, in Technical Report Series 854: Physical Status: The Use and Interpretation of Anthropometry. The cut-offs were based on mortality and morbidity associations in predominantly European-origin populations.
What was the Quetelet index originally designed for?
The Quetelet index was designed as a statistical description of l'homme moyen, the average man. It was a tool for 19th-century social physics, used to describe the shape of populations, not to screen individuals for health risk.
Why did Ancel Keys study body-mass indices?
By the 1960s, researchers had at least a dozen different formulas with no consensus on which best predicted body fat. Keys' 1972 comparative study systematically tested them against skinfold and densitometry measurements in five male cohorts to find the most reliable formula.
Did Keys intend BMI to be used as an individual diagnostic?
No. Keys validated BMI as a population-level predictor of body fat. The shift from describing populations to screening individuals happened later, particularly with the WHO's 1995 adoption that locked BMI into global clinical practice.
What is the biggest misunderstanding about BMI?
The biggest misunderstanding is treating a BMI number as a direct readout of metabolic health or body fatness for a specific person. BMI is a population screening statistic, not an individual diagnostic. It was designed to spot statistical shifts in large groups, not to label individual bodies.