BMI Misclassification in Athletes and People with High Lean Mass: Quantifying the Overestimate
How far BMI overstates health risk in athletes and muscular builds, with measured examples from published studies and alternative body composition methods.
BMI Misclassification in Athletes and People with High Lean Mass: Quantifying the Overestimate
BMI misclassification in muscular builds is a systematic failure of the Quetelet index. A person carrying 15 kg more skeletal muscle than average and 5 kg less body fat can land in the same BMI band as someone with the opposite makeup. The problem is arithmetic. BMI divides weight in kilograms by the square of height in metres, and weight does not distinguish muscle from fat. This guide quantifies that overestimate using measured data and explains what alternative assessments are used in practice.
An American football lineman with a BMI of 33 kg/m² hits the WHO adult obesity threshold. Yet DXA data from published cohorts show these athletes can have body fat in the normal range, 12-18%, while a sedentary man of the same BMI may carry 30% body fat. Same BMI number. Entirely different risk profiles. Sumo wrestlers present the inverse: high BMI but low visceral adipose tissue relative to their total mass, with metabolic health profiles that contradict the BMI category. The WHO committee that set the 18.5-24.9 normal range in 1995 (Technical Report Series 854) did not design the bands for muscular bodies.
By How Much Does BMI Overstate Body Fat in Athletes?
The key question is magnitude, not direction. BMI overestimates body fat in athletes, but the error is not uniform across all sports or all individuals. A meta-analysis of 25 studies (Okorodudu et al., 2010, pooled n=31,968) found that the sensitivity of BMI ≥30 for detecting obesity defined by body fat proportion (≥25% in men, ≥35% in women) was only 36% in men and 49% in women. Specificity was 99% in both sexes. Most muscular men who have a normal body fat reading by DXA will be falsely flagged as obese by BMI. The false positive rate in athletes is far higher than in the general population because the lean-mass fraction skews the weight-height ratio upward.
An athlete with a BMI of 28 kg/m² may have body fat of 14% by air displacement plethysmography or hydrostatic weighing. A non-athlete with the same BMI may have body fat of 28%. The Quetelet index cannot separate these cases. The error is not 1-2 kg/m²; it can be 5-10 points of body fat misattribution. The WHO Asian BMI thresholds (2004) and national guidelines in Singapore and India have adopted lower cut-offs for metabolic risk, but those adjustments address ethnic body-composition differences, not the lean-mass problem.
BMI Overestimates Body Fat in Athletes: The Measured Evidence
Football Linemen and the False Obesity Flag
A 2011 analysis of professional American football players found that 52% of linemen were classified as obese by BMI. Only 12% had a body fat reading above the standard athlete threshold of 22% by DXA. The remaining 40% would be incorrectly labelled obese despite a fat-free mass index well above population norms.
The Sumo Wrestler Paradox
Sumo athletes have a mean BMI around 38 kg/m², class II obesity by WHO thresholds. Yet CT scans show low visceral fat, normal glucose tolerance, and favourable lipid profiles. Their metabolic health is better than that of many non-obese controls with the same BMI. The BMI number cannot distinguish the sumo wrestlers' high lean mass and subcutaneous fat from the visceral obesity that drives cardiometabolic risk.
What NHANES Data Reveals
In the general US population, the share of overweight-BMI adults (25-29.9 kg/m²) who have normal body fat by DXA is about 16% in men and 8% in women. Among trained athletes, that share rises substantially. The practical consequence: a doctor, coach, or screening programme that relies solely on BMI will systematically misdirect resources. It will flag muscular athletes for interventions they do not need while missing normal-weight individuals with excess body fat, a condition called normal-weight obesity.
Lean Mass and the BMI False Positive for Overweight: Why It Happens
The Quetelet index was never intended for individual diagnosis. Adolphe Quetelet designed it in the 19th century as a statistical descriptor of the 'average man,' not as a health screening tool. Lean body mass is denser than fat mass, but the BMI formula treats all kilograms identically. A person who gains 5 kg of muscle through resistance training increases their BMI by about 1.5 kg/m², depending on height, and may cross the overweight threshold without any increase in body fat. Conversely, a person who loses lean mass through ageing or illness may stay in the normal BMI range while their body fat rises into the obese range, the phenomenon called sarcopenic obesity.
The false positive rate in the overweight band (BMI 25-29.9) is highest in populations with above-average muscle mass: athletes, manual labourers, and military personnel. A systematic review of body-composition studies in elite powerlifters found that the large majority of male competitors had a BMI above 30 kg/m², yet their mean body fat by DXA was 16.2%, safely within the healthy range for the general population. The BMI label 'obese' is descriptively false for those individuals. The screening test's specificity for excess adiposity in the 25-30 range drops sharply as lean mass rises.
Body Fat Percentage in Athletes vs. BMI: What the Numbers Actually Say
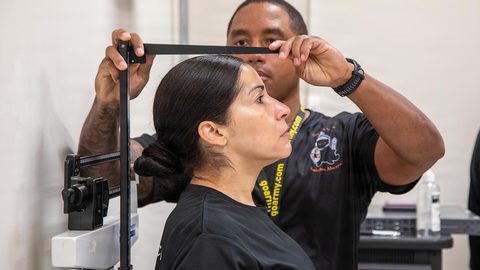
The only way to determine body makeup, lean mass versus fat mass, is a direct assessment method, not a height-weight ratio. The available methods for athletes include: DXA (dual-energy X-ray absorptiometry), which measures fat, lean, and bone mass with an individual error of ±1-3% body fat depending on the device; hydrostatic weighing, the historical gold standard with ±2-3% error if residual volume is correctly measured; air displacement plethysmography (Bod Pod) with ±2-4% error; BIA (bioelectrical impedance analysis) with ±3-8% error and high sensitivity to hydration status; and skinfold measurement with ±3-5% error when performed by a trained technician using standardised sites.
Each method has limitations. BIA in athletes is especially problematic because the prediction equations are calibrated on general populations and systematically underestimate lean mass in muscular individuals. A 2015 study comparing BIA to DXA in collegiate athletes found that BIA underestimated body fat by 2.5% on average, shifting some athletes from 'normal' into 'overfat' categories. Skinfold measurement relies on the technician's skill and the choice of prediction equation (e.g., Jackson-Pollard, 7-site vs 3-site); inter-tester error of ±2-5% body fat is common. For the athlete who needs a single reliable number, DXA or a 4-compartment model (hydrostatic weighing plus DXA plus total body water) is the research standard. For screening, skinfold measurement by a trained practitioner is more informative than BMI alone.
| Method | Individual Error (±% body fat) | Best Use Case |
|---|---|---|
| DXA | 1–3% | Research reference; distinguishes fat, lean, bone mass; not portable; moderate cost |
| Hydrostatic weighing | 2–3% | Gold standard for decades; requires complete exhalation and residual volume correction; not portable |
| Air displacement plethysmography (Bod Pod) | 2–4% | Portable alternative to hydrostatic; error increases with clothing, facial hair, body temperature changes |
| BIA | 3–8% | Fast, cheap; highly sensitive to hydration, recent food, exercise, skin temperature; athlete-specific equations improve accuracy |
| Skinfold calipers | 3–5% | Requires trained technician and standardised site protocol; inter-tester error 2–5%; portable and low cost |
Muscle Weight and the BMI Screening Error: A Screening Tool, Not a Diagnostic
The BMI screening error in athletes is not a flaw in the arithmetic; it is a category error by the user. The WHO, CDC, and NICE guidelines all state that BMI is a population screening tool, not an individual diagnostic. A screening test that misclassifies 40% of a subgroup is not a useful screening test for that subgroup. The practical response is to bypass BMI entirely for anyone with visibly high muscle mass, competitive athletes, strength trainers, manual workers, and use an alternative first-line assessment.
NICE CG189 (2022) introduced waist-to-height ratio as a central adiposity marker alongside BMI. The threshold: waist circumference less than half height (ratio <0.5). This measurement does not use weight at all, so muscle mass does not inflate it. A 185 cm athlete with a 95 cm waist has a waist-to-height ratio of 0.51, just above the 0.5 cut-off, indicating increased cardiometabolic risk regardless of BMI. That same athlete may have a BMI of 30 kg/m² (obese) and body fat of 15% (healthy). The waist-to-height ratio captures the actual risk signal, central adiposity, while BMI captures weight alone.
Athlete Body Composition Measurement Alternatives: What to Use Instead of BMI
For any muscular individual who wants a meaningful body-composition assessment, the alternatives are: waist-to-height ratio (self-administered with a tape measure, protocol: midpoint between lowest rib and iliac crest at end of normal expiration, per WHO protocol), waist circumference with NIH/NHLBI thresholds (men >102 cm, women >88 cm, 1998 guidelines based on Nurses' Health Study and Health Professionals Follow-up Study), or body fat measurement by a trained professional using skinfold calipers or BIA with athlete-specific algorithms.
The failure mode: a muscular athlete with BMI 28 and waist circumference 84 cm (below the NIH/NHLBI high-risk threshold for men) is not at elevated cardiometabolic risk despite the BMI label. If that athlete uses a consumer smart scale that estimates body composition via BIA without controlling for hydration, the error may be ±5% body fat or more. Book a DXA scan or a skinfold measurement with a technician who uses a standardised protocol, such as the International Society for the Advancement of Kinanthropometry protocol, rather than relying on a BMI number from a scale, an app, or a doctor's surgery.
The Single Most Practical Step for Any Muscular Individual
Ignore any BMI number that comes from a scale, an app, or a doctor's surgery without a body-composition measurement attached. Measure your waist circumference at the midpoint between the lowest rib and the iliac crest, per WHO protocol, at the end of a normal exhalation. Divide that number by your height in the same units. If the result is below 0.5, you are below the NICE CG189 threshold for cardiometabolic risk, regardless of your BMI. If it is above 0.5, schedule a DXA scan or a skinfold measurement by a trained technician to confirm whether the higher ratio is caused by muscle mass or visceral fat. The one thing that most often goes wrong: an athlete with low body fat but a high BMI assumes they are unhealthy, adjusts training or diet based on a false signal, and loses lean mass that was protecting their metabolic health. The BMI number is not the problem. Treating it as a personal health grade is.
More in this guide
When BMI Reads Wrong: Populations for Whom Standard BMI Misclassifies Health RiskBMI and Ageing: How the Risk Curve Shifts in Older Adults and Why Sarcopenia Changes the Picture.
Common Questions
If my BMI is 28 and I am muscular, am I healthy?
BMI alone cannot answer that. A BMI of 28 in a muscular individual may correspond to body fat of 15-18% by DXA (healthy) or 30% (overfat). You need a direct body-composition measurement, waist-to-height ratio, skinfold calipers, or DXA, to know.
What waist circumference indicates risk for an athlete?
For most adults, NICE CG189 advises a waist-to-height ratio below 0.5. NIH/NHLBI uses >102 cm for men, >88 cm for women. These thresholds were derived from general populations; in athletes, the waist-to-height ratio is more informative because it does not use weight.
Can I use a smart scale BIA reading for my athlete body fat?
Not reliably. BIA error is ±3-8% body fat and is highly sensitive to hydration, recent food, and exercise. A pre-competition dehydrated athlete may get a reading 5% lower than their true body fat. Use DXA or skinfold calipers instead.
Why do sumo wrestlers have high BMI but good metabolic health?
Sumo wrestlers carry low visceral fat relative to total mass, despite high subcutaneous fat. Their high lean mass and physical training offset the metabolic risk associated with high BMI. This illustrates why BMI cannot distinguish visceral from subcutaneous fat.