The BMI Categories and the Evidence Behind Each Cut-Off
The WHO adult BMI categories were fixed by an expert committee in the 1990s using epidemiological cut-points, not physiological thresholds. Every band names its source and year.
The BMI Categories and Where the WHO Cut-Offs of 25 and 30 Come From
A BMI of 24.9 is not a finish line. A BMI of 25.0 is not a cliff edge. The World Health Organization cut-offs at 25 and 30 were never designed as personal health grades. They are statistical boundaries where population-level risk curves inflect. Epidemiological cut-points. Not physiological thresholds where something inside the body changes. Here is the evidence behind every band, the year each was published, and what the categories actually mean for screening.
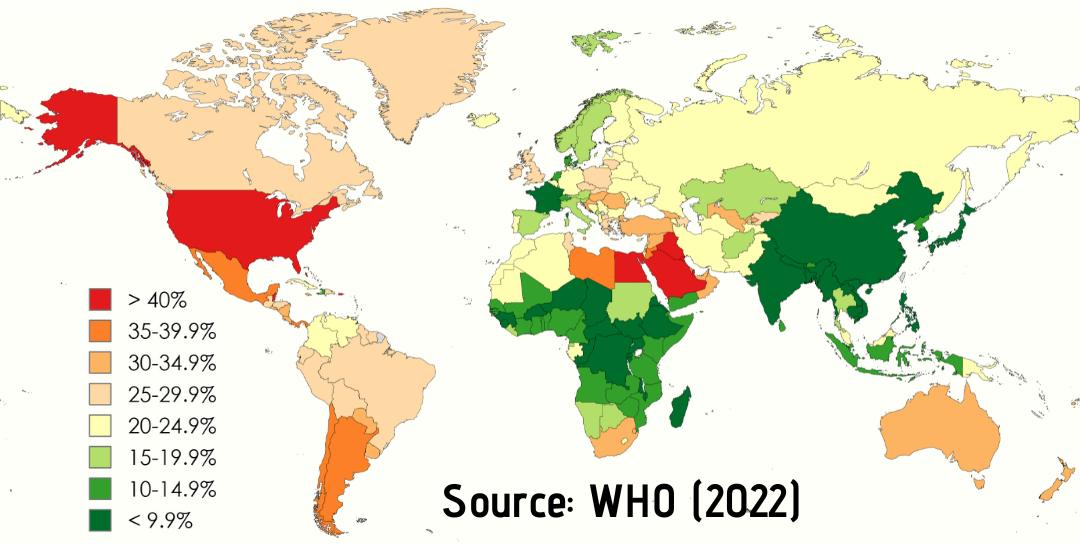
WHO BMI Classification 1995: The Original Bands
WHO Technical Report Series 854, published in 1995 under the title Physical status: the use and interpretation of anthropometry, fixed the adult BMI categories still in use. The committee reviewed epidemiological data on the association between body mass index and morbidity and mortality, then set boundaries where the risk curves steepened. The report defined underweight as below 18.5, normal weight from 18.5 to 24.9, overweight from 25.0 to 29.9, and obesity at 30 and above. These were statistical bands for population surveillance, not clinical diagnoses for individuals.
Why 25 Was Chosen as the Overweight Threshold
The 1995 expert consultation selected a BMI of 25 as the overweight cut-off because meta-analyses showed a detectable increase in all-cause mortality and chronic disease risk beginning near that point. The committee did not claim that a person crossing 25 suddenly became unhealthy. It said that at a population level, the risk curve starts to bend upward around 25. The choice was pragmatic. It was based on observational data from Western European and North American cohorts.
Why 30 Was Chosen as the Threshold for Obesity
BMI 30 was set as the cut-off because the epidemiological evidence, primarily from the same Western cohorts, showed a sharper increase in morbidity from type 2 diabetes, cardiovascular disease, and certain cancers at or above that level. The Prospective Studies Collaboration analysis of 900,000 adults, published in The Lancet in 2009, confirmed that each 5-unit increase in BMI above 25 was associated with a 30 percent increase in all-cause mortality. That study used data collected after the cut-offs were set. The 1995 committee did not have that exact number but had consistent findings from smaller pooled studies.
The 2000 Report: Obesity Preventing and Managing the Global Epidemic
The WHO reaffirmed the 1995 cut-offs in its 2000 report Obesity: Preventing and Managing the Global Epidemic (WHO Technical Report Series 894). That document reviewed additional evidence from the International Obesity Task Force. It kept the same four broad bands, underweight, normal, overweight, obese, but introduced three obesity subcategories. The report stated clearly that the thresholds were "epidemiological cut-points" and that individual health assessments require clinical evaluation, not just a BMI number.
| Category | BMI Range (kg/m²) | Source / Year |
|---|---|---|
| Underweight | < 18.5 | WHO Technical Report Series 854, 1995 |
| Normal weight | 18.5 – 24.9 | WHO Technical Report Series 854, 1995 |
| Overweight | 25.0 – 29.9 | WHO Technical Report Series 854, 1995 |
| Obese Class I | 30.0 – 34.9 | WHO Technical Report Series 894, 2000 |
| Obese Class II | 35.0 – 39.9 | WHO Technical Report Series 894, 2000 |
| Obese Class III | ≥ 40.0 | WHO Technical Report Series 894, 2000 |
BMI 25 Overweight Threshold: What the Evidence Says
The overweight threshold at 25 was not pulled from a single study. The WHO expert consultation reviewed multiple prospective cohort studies that measured cardiometabolic risk across BMI ranges. The risk for type 2 diabetes begins a measurable upward slope around BMI 23 in some populations, but the committee chose a conservative, single cut-off that could be applied globally. The 1998 NHLBI clinical guidelines in the United States endorsed the same number. So did the CDC and the NHS.
A critical detail: the risk curve is J-shaped. Mortality is lowest around BMI 22.5 to 25 and rises on both sides. The normal weight band covers the lowest part of the curve but also includes people whose BMI is below the nadir. The underweight band, below 18.5, is associated with increased mortality from other causes, including infectious disease and complications of chronic illness.
BMI 30 Obesity Threshold: The Evidence Behind the Line
BMI 30 marks the point where the epidemiological risk for metabolic and cardiovascular disease increases substantially. The 1995 committee had data from the Nurses' Health Study and other large cohorts showing that women with a BMI of 35 or higher had a relative risk of 38.8 for type 2 diabetes compared to those below BMI 23, as reported by Colditz et al. in 1995. The 30 cut-off captured the majority of elevated risk without being so high that it missed people who needed screening.
The Three Obesity Classes
The 2000 report split obesity into three classes. Class I (30-34.9), Class II (35-39.9), and Class III (40 and above). The risk gradient within obesity is steep. Some national bodies, including the NHS in the UK, subdivide Class III further into obesity III (40-49.9) and super obesity (50+), but the WHO has not adopted those subdivisions at the global level. The three-class system is the international standard.
Underweight Normal Overweight Obese Bands: How They Work Together
The four broad bands form a single screening framework. They are not diagnostic categories. The underweight/normal/overweight/obese classification tells you where a person falls on a reference distribution of weight for height. It does not tell you whether they have excess body fat or metabolic dysfunction. The WHO has always stated that BMI is a screening tool, not a diagnostic. The 1995 report emphasized that "the use of the cut-off points for obesity should be considered as a screening, not a diagnostic, tool for individuals."
How the Bands Work for Children and Adolescents
For children and adolescents aged 2 to 19, the same principle applies but the thresholds are different. The CDC 2000 growth charts use percentiles. Underweight below the 5th percentile. Normal from the 5th to below the 85th. Overweight from the 85th to below the 95th. Obesity at the 95th and above. The percentile describes where the child sits on a reference distribution of children of the same age and sex. It is not a direct measure of adiposity.
What These Cut-Offs Do Not Mean
The failure case for the BMI categories is treating them as personal health verdicts. A person with a BMI of 25.1 is not automatically at higher risk than someone at 24.9. The risk curve is continuous. The cut-offs are arbitrary points on that curve, chosen for consistency across studies. The measurement error from self-reported height and weight alone shifts the average BMI downward by 0.5 to 1.5 kg/m². That is larger than the gap between categories for many people. If a scale or app tells you that you are above a statistical threshold, it does not mean you have a diagnosis.
More in this guide
Understanding BMI: A Guide to Body Mass Index Screening and Its LimitsHow the Quetelet Index Became Body Mass Index and a Global Screening ToolHow Accurate BMI Is When Applied to a Single Individual.
Frequently Asked Questions About BMI Categories
Are the WHO BMI cut-offs the same for everyone?
No. The WHO issued separate, lower thresholds for Asian populations in 2004 based on higher risk of type 2 diabetes at lower BMI. Countries including India, Singapore, and Japan have adopted national guidelines with lower overweight and obesity cut-offs.
Why is 18.5 the underweight cut-off?
The 1995 WHO committee set 18.5 as the lower bound of normal based on epidemiological evidence that mortality and morbidity from undernutrition, infections, and other causes increase below that point. It is a population risk threshold.
Can BMI misclassify a healthy person as overweight?
Yes. BMI has high specificity at extreme values but poor specificity in the overweight range. NHANES data shows a substantial fraction of adults with overweight BMI have normal body fat percentage by DXA, especially among athletes and muscular individuals.
Will the WHO ever change the 25 and 30 cut-offs?
They have not changed since 1995 and 2000. A revision would require a new WHO expert consultation and systematic evidence review. The key question would be whether the epidemiological risk curves have shifted enough in modern populations to justify new boundaries.
.png)