Muscle Mass and BMI Misclassification: Why High Lean Mass Reads as Obesity
BMI cannot tell muscle from fat, so muscular individuals often read as obese. Learn why this happens, what body composition measurements to use instead, and the error margins of each.
BMI Muscle Mass Misclassification Athlete: Why High Lean Mass Reads as Obesity
A bodybuilder at 10% body fat and an office worker at 30% body fat can walk into the same clinic, step on the same scale, and get the same BMI number. The scale and the tape measure cannot tell the difference between quadriceps and adipose. That is not a bug in the machine. It is a feature of the Quetelet index, designed in the 1830s as a statistical description of the average man, not as a body composition tool for a 110 kg rugby forward.
BMI divides weight in kilograms by height in metres squared. It returns a number. It does not say what that weight is made of. A person with 85 kg of lean body mass and a person with 55 kg of lean mass plus 30 kg of fat can produce the same BMI if their heights align. This is the athlete problem, and it is the core limitation of using a population screening tool for individual diagnosis.
The WHO adult BMI cut-offs, underweight <18.5, normal 18.5-24.9, overweight 25.0-29.9, obese ≥30.0, were fixed in 1995 by the Technical Report Series 854 and reaffirmed in 2000. They were derived from epidemiological data on population-level disease risk, not from individual body composition measurements. A muscular person who falls into the overweight or obese bracket by BMI is not necessarily overfat. The question is whether the elevated BMI reflects excess fat mass or excess fat-free mass.
Why Muscular People Have High BMI
Muscle mass is denser than fat mass. One kilogram of muscle occupies roughly 20% less volume than one kilogram of fat. A person who carries 10 kg more muscle than the average person of the same height will weigh 10 kg more, and their BMI will be roughly 3 kg/m² higher. For a 1.80 m male, that can push a BMI of 24.0, the upper end of normal, to 27.0, which sits solidly in the overweight band.
Consider American football linemen. NFL players have a mean BMI of 31.6, which falls into WHO obesity class I (30.0-34.9). Body fat levels for these athletes range from 9% to 25% depending on position. A lineman at 15% body fat with a BMI of 32 is not obese by body composition standards, but the screening tool classifies him as such. The same pattern appears in rugby forwards, heavyweight rowers, shot putters, and competitive bodybuilders.
The failure case: a muscular person who relies on BMI alone to assess their health may be told by a doctor, an app, or a gym scale that they are overweight or obese. That classification can trigger unnecessary concern, inappropriate dieting, or a missed opportunity to focus on actual metabolic health markers. The number on the scale is not the number that matters.
BMI Overestimates Body Fat in Athletes
The phrase BMI overestimates body fat in athletes is misleading if it suggests BMI always overestimates. The correct statement: BMI cannot estimate body fat at all, and in people with high lean body mass, the BMI number predicts a body fat proportion that is systematically too high. The error is not random. It is directional.
In the NHANES data, a substantial fraction of adults in the overweight BMI range have normal body fat by dual-energy X-ray absorptiometry (DXA). The reverse also occurs: a significant fraction of normal-BMI adults have excess body fat, a condition known as normal-weight obesity. The sensitivity of BMI ≥30 for detecting excess body fat is roughly 50%, meaning half of the people with excess adiposity by DXA have a BMI below 30. The specificity is high, around 95%, so few people with a BMI ≥30 have normal body fat, but the false positive rate is not zero.
For the athlete, the implication is direct: if you have a high BMI and low body fat, the screening tool is not wrong in the arithmetic sense, your weight divided by height squared is genuinely high, but it is wrong in the interpretive sense. It does not measure what you think it measures. The correct response is not to ignore the number, but to pair it with a direct body composition measurement.
| Measurement | What It Measures | Individual Error Range | Best For |
|---|---|---|---|
| BMI (kg/m²) | Weight-for-height ratio | Cannot estimate body fat; misclassifies muscular people | Population screening, quick triage |
| Waist circumference (cm) | Abdominal girth, surrogate for visceral fat | ±2–5 cm inter-observer; self-measured unreliable | Central adiposity risk, adds information beyond BMI |
| Waist-to-height ratio | Abdominal girth scaled to height | ±0.02–0.05 dimensionless; NICE 0.5 threshold | Population health signal, adjusts for body size |
| Body fat percentage by DXA | Fat, lean, and bone mass | ±1–2% body fat; varies by manufacturer | Reference method, research and clinical use |
| Body fat percentage by skinfold | Subcutaneous fat at defined sites | ±3–5% body fat vs DXA; technician-dependent | Field method with trained operator |
| Body fat percentage by BIA | Hydration-dependent estimate | ±3–8% body fat vs DXA; systematic by device | Consumer convenience, not for precise tracking |
Body Composition for Muscular Individuals
Choosing a Body Fat Measurement
If you have high muscle mass and a BMI above 25, the measurement you need is body fat percentage. No single universal healthy range exists across all methods and populations, but the American Council on Exercise published classification ranges that are widely cited: for men, essential fat 2-5%, athletes 6-13%, fitness 14-17%, acceptable 18-24%, obesity ≥25%. For women: essential fat 10-13%, athletes 14-20%, fitness 21-24%, acceptable 25-31%, obesity ≥32%.
The measurement method matters. DXA distinguishes fat, lean, and bone mass with a precision error of ±0.5-1.0% for repeat scans, but results vary between manufacturers, Hologic versus GE Lunar can differ by 2-6% body fat. Skinfold measurement, in the hands of a trained operator using a validated prediction equation, can achieve ±3-5% body fat versus a four-compartment model, but inter-rater error of ±2-3% body fat is typical if the technician is not calibrated. Bioelectrical impedance analysis (BIA) is the most convenient and the most error-prone: errors of ±3-8 percentage points versus DXA are common, and the error is systematic by device algorithm and random by user state, hydration, recent exercise, food intake, and skin temperature all shift the reading.
For the muscular person who wants a reliable number: book a DXA scan at a sports medicine clinic or university lab. It costs roughly 75-150 USD, takes 10 minutes, and gives you total body fat percentage, lean mass distribution, and bone density. If DXA is not available or affordable, find a trained professional who uses skinfold calipers with a published equation (the Jackson-Pollock 3-site or 7-site formulas are common). Do not rely on a smart scale or a gym BIA device for a reading you plan to act on.
What to Do If You Cannot Get a Direct Measurement
Waist circumference and waist-to-height ratio are the best tape-measure alternatives for athletes. They do not measure body fat percentage directly, but they capture central adiposity, which is the component of body composition most strongly associated with metabolic disease risk. The NICE guideline CG189 (2022) advises keeping waist-to-height ratio below 0.5. The NIH/NHLBI waist circumference thresholds for increased cardiometabolic risk are >102 cm for men and >88 cm for women, though these cut-offs were derived from white populations and may not apply to all ethnic groups. The International Diabetes Federation uses lower thresholds: ≥94 cm for Europid men, ≥80 cm for Europid women, and ethnicity-specific adjustments for South Asian, Chinese, and Japanese populations.
Alternatives to BMI for Athletes
Waist-to-Height Ratio: The 15-Second Check
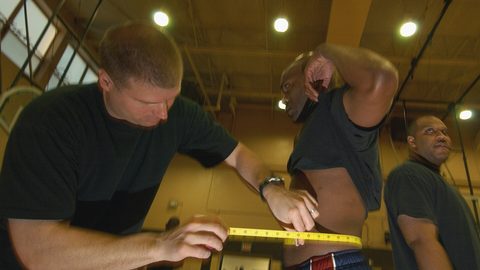
The single most useful number for an athlete is waist-to-height ratio. It requires only a tape measure, takes 15 seconds, and outperforms BMI for detecting cardiometabolic risk in a 2012 meta-analysis of 300,000 people across 31 studies. Measure at the midpoint between the lowest rib and the iliac crest, exhale normally, and keep the number below 0.5. That heuristic applies across sex, age, and ethnicity. It does not require a reference table or a calculator.
Waist circumference alone is also useful but carries more protocol baggage. The WHO protocol measures at the midpoint; the NIH protocol measures at the top of the iliac crest. The difference between the two sites is 1-4 cm, which can shift a person across a risk threshold. Self-measured waist circumference is unreliable, with errors commonly exceeding 3-5 cm. If you cannot get a trained observer, use waist-to-height ratio instead.
Body fat percentage by DXA remains the reference method for total body composition, but it is not a routine screening tool. It is expensive, requires a scanner, and exposes the person to a small dose of ionising radiation (roughly equivalent to a day of background radiation). Skinfold measurement by a trained operator using a caliper and a validated prediction equation is the best low-cost field method, but the accuracy depends entirely on the technician. A single bad measurement is worse than no measurement.
What the Numbers Actually Mean
The distinction between overweight by BMI (25-29.9 kg/m²) and overfat by direct measurement is the central concept. A person can be overweight by BMI and not overfat, the muscular athlete. A person can be normal-weight by BMI and overfat, the sedentary older adult with low muscle mass and high body fat, known as normal-weight obesity. The same BMI number means different things in different bodies.
The failure case for an athlete who relies on BMI: if you are a male at 12% body fat with a BMI of 27, and you try to lower your BMI to 24.9 by losing weight, you will lose muscle mass. That is the wrong goal. The correct goal is to maintain or improve body composition, to keep lean mass while managing fat mass. BMI cannot guide that process. A waist-to-height ratio below 0.5 or a body fat percentage in the athlete range (6-13% for men, 14-20% for women per ACE) is the better target.
The Single Thing That Most Often Goes Wrong
A muscular person gets a BMI number that classifies them as overweight or obese. They react by trying to lower that number, cutting calories, increasing cardio, losing weight. The weight they lose is often a mix of fat and muscle. Their body composition worsens. Their metabolic health may decline even as their BMI number falls into the normal range. They have treated a screening tool as a diagnostic, and the screening tool was never designed for that job.
If your BMI is high because of muscle mass, the correct move is not to reduce your weight to fit a population-based threshold. It is to measure your body fat percentage directly, and if that number is in a healthy range, to ignore the BMI classification entirely. The athlete problem is not a problem with the athlete. It is a problem with applying the wrong measurement to the wrong person.
Common Questions
Can two people with the same BMI have completely different body compositions?
Yes. Two people with identical BMI can differ in body fat percentage by 10-20 percentage points. One may have high lean body mass and low body fat; the other may have average lean mass and high body fat. BMI does not distinguish between the two.
What is the error margin of BMI for estimating body fat in athletes?
BMI cannot estimate body fat. The misclassification rate is high in muscular populations. In NHANES data, about 50% of people with excess body fat by DXA have a BMI below 30, and a smaller but significant fraction with BMI ≥30 have normal body fat.
Should a muscular person with a BMI of 28 be concerned about their health?
Not based on BMI alone. The concern should be based on body fat percentage, waist circumference, and metabolic markers such as blood pressure, blood glucose, and lipid profile. The BMI number is a screening tool, not a diagnostic.
What is the most accurate way to measure body fat for a muscular person?
Dual-energy X-ray absorptiometry (DXA) is the most accessible reference method, with a precision error of ±1-2% body fat. The four-compartment model, which combines DXA, hydrostatic weighing or air displacement plethysmography, and deuterium dilution, is the research gold standard with error below 1% body fat.
Can BIA from a smart scale give a reliable body fat reading for an athlete?
No. BIA devices show errors typically in the range of ±3-8 percentage points versus DXA, and the error is systematic by manufacturer algorithm. Hydration status, recent exercise, food intake, and skin temperature all affect the reading. A smart scale is not a reliable tool for body composition tracking.
Why does the WHO use BMI cut-offs that misclassify athletes?
WHO adult BMI cut-offs were developed for population screening, not individual diagnosis. They were derived from epidemiological studies showing elevated risk of type 2 diabetes and cardiovascular disease at specific BMI thresholds in large populations. The cut-offs were never intended to be applied to people with atypical body composition.
What alternatives to BMI exist for assessing health in muscular people?
Waist circumference, waist-to-height ratio, and body fat percentage by DXA, skinfold measurement, or BIA (with caveats) are alternatives. Waist-to-height ratio has the advantage of a single dimensionless cut-off (0.5) that applies across sex, age, and ethnicity, per NICE CG189. Body fat percentage gives the most direct assessment of adiposity.