Body Mass Index Calculator and What Your BMI Number Actually Means
Use this BMI calculator to see your number and learn what the WHO categories from 1995 actually mean for one person—and what they cannot tell you about your body.

Body Mass Index Calculator and What Your BMI Number Actually Means
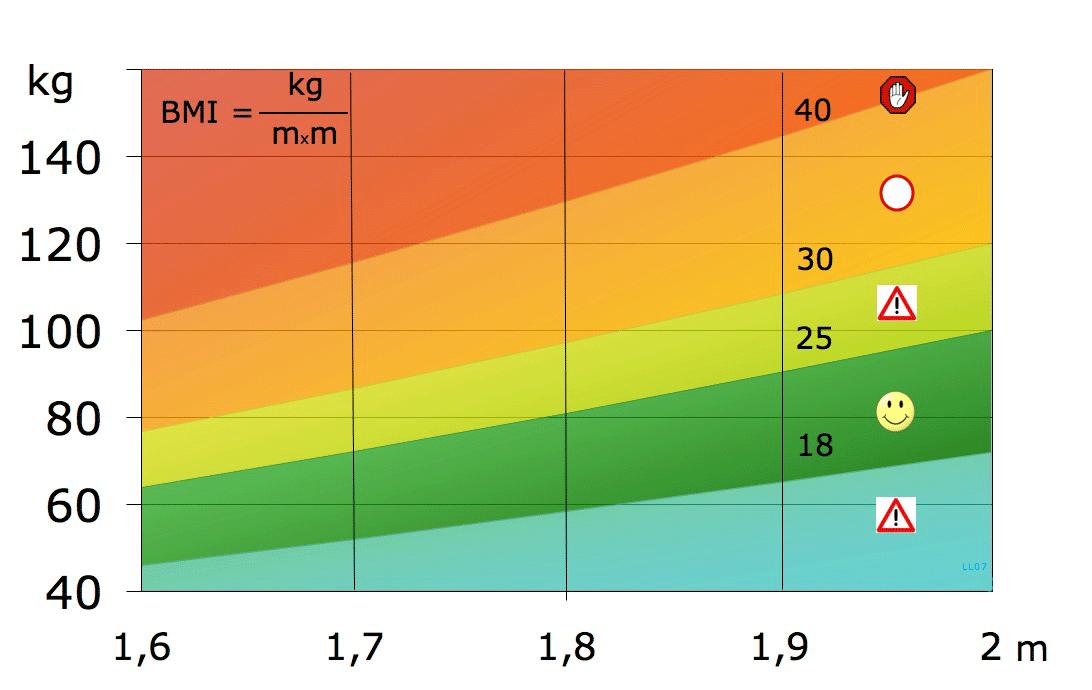
BMI is a ratio of weight to height squared. It sorts you into a category, underweight, normal, overweight, or obese, designed to spot statistical trends in large populations. It was never built to diagnose your personal health. Use the calculator below, then read on. The arithmetic in metric and imperial units, the thresholds, and the limits of the number are all here.
- Formula (Metric): weight (kg) / [height (m)]²
- Formula (Imperial): [weight (lb) / height (in)²] × 703
- WHO Normal Range: 18.5-24.9 kg/m²
- WHO Overweight: 25.0-29.9 kg/m²
- WHO Obese Class I: 30.0-34.9 kg/m²
- WHO Obese Class II: 35.0-39.9 kg/m²
- WHO Obese Class III: ≥ 40.0 kg/m²
- NICE Waist-to-Height Threshold: Waist circumference > half height
The BMI Formula in Kg and Lbs: How the Arithmetic Works
The body mass index calculator uses one formula whether you work in metric or imperial. In metric, divide weight in kilograms by the square of height in metres. Weight 75 kg, height 1.75 m: 75 ÷ (1.75 × 1.75) = 24.5 kg/m². A normal result.
In imperial, the formula is the same ratio with a conversion factor. Divide weight in pounds by the square of height in inches, then multiply by 703. Weight 165 lb, height 69 in: (165 ÷ 4761) × 703 = 24.4. The same person, the same category.
The conversion factor 703 comes from 39.37 inches per metre and 2.2046 pounds per kilogram. You do not need to remember it; the calculator below does the work. What matters is that you use measured values, not estimates. Self-reported height and weight shift the result downward by roughly 0.5 to 1.5 kg/m² on average, and the gap is larger in heavier individuals.
WHO BMI Categories: Where the Thresholds Come From
The World Health Organization set the adult cut-offs in 1995, published in Technical Report Series 854, and reaffirmed them in 2000 in Obesity: Preventing and Managing the Global Epidemic. They are epidemiological cut-points, not physiological thresholds. The committee chose them based on the shape of the risk curve across populations, not on a direct measure of body fat or metabolic health in any one person.
The bands: underweight below 18.5, normal from 18.5 to 24.9, overweight from 25.0 to 29.9, obese class I from 30.0 to 34.9, obese class II from 35.0 to 39.9, obese class III at 40.0 and above. These are the global standard, but they are not universal. The same BMI can represent a different body composition in different groups.
Asian Cut-Offs
In 2004 the WHO Western Pacific Region published lower thresholds for Asian populations because the risk of type 2 diabetes and cardiovascular disease appears at a lower BMI. For many Asian groups the normal range stops at 22.9, overweight begins at 23.0, and obesity at 25.0. Countries including India, Singapore, and Japan follow these or their own national adaptations. Always check which threshold your own health system uses.
What Does My BMI Mean? The J-Shaped Risk Curve and the Limits of the Number
If you landed near a boundary, a BMI of 24.8 or 30.1, you want to know what that fraction means for you. The answer is complicated, and honest.
In large observational studies, the relationship between BMI and all-cause mortality is J-shaped or U-shaped. The lowest risk sits somewhere in the normal to low-overweight range, then rises on both sides. But that curve is a population average, not a personal forecast. The nadir, the BMI with the lowest risk, shifts with age, sex, ethnicity, and baseline health. The curve is also confounded by reverse causation: illness can cause weight loss, which pulls the left side of the J upward in data.
Why BMI Is Not a Body Fat Reading
Body mass index is a screening tool, not a diagnostic. It identifies people who may need further assessment. It does not measure body fat percentage, and it cannot distinguish between lean mass and adipose tissue. In NHANES data, a substantial minority of adults with a normal BMI have excess body fat by DXA, a phenomenon called normal-weight obesity. Conversely, many adults in the overweight category have a normal body fat percentage, especially those who carry more muscle or have a broader frame.
The systematic error from self-reported height and weight is another layer. If you entered your own numbers, they are likely biased. The arithmetic runs in your browser and no data is sent anywhere, but the input is only as good as the measurement.
What Else to Look At
If BMI is a population screening tool, what should an individual use? Three measures add information beyond weight and height. Waist circumference, measured with a tape at the narrowest point of the torso, captures central obesity risk. The NIH/NHLBI threshold for increased risk is 102 cm (40 in) for men and 88 cm (35 in) for women, though these were derived from white populations and do not transfer directly to all ethnic groups. Waist-to-height ratio, recommended by NICE in CG189 (2022), uses a single dimensionless cut-off: keep your waist circumference below half your height. That 0.5 rule is a population heuristic, not a personalised risk score, but it corrects for frame size without needing sex-specific thresholds.
Body fat percentage from DXA is more informative than any tape measure, but DXA is a research and clinical tool, not something you use at home. BIA scales estimate body fat by passing a small current through your body, but the results are highly sensitive to hydration, recent exercise, and the device algorithm. Individual errors fall in the range of ±3-8 percentage points. No single number from a consumer device is trustworthy enough to act on.
Who This Suits and Who Should Skip
The calculator and the explanation fit the person who just got a BMI number from a doctor, an app, or a scale and needs to know what it actually means without being sold a programme. They also suit the parent or carer told their child is at a particular centile and needs to understand how paediatric BMI works differently, the CDC 2000 growth charts for ages 2 to 19 plot a child against a reference distribution, not a fixed threshold, and two children at the same centile can have very different body compositions.
The fitness or health professional who needs the provenance of every threshold and the evidence behind waist-to-height ratio will find the named sources here. The data-literate reader who has seen BMI criticised online gets the supported criticisms and the genuine authority gaps.
Skip this page if you are looking for a diet plan, a calorie target, or a workout schedule. The site explains measurement and screening; it does not prescribe action. If you want to decide whether to take a weight-loss drug, you need a prescribing clinician, not a calculator. If you want to know whether you are healthy based on BMI alone, this page explains why that question cannot be answered by a single anthropometric number, and why you need a medical consultation for a personal health assessment.
Common Questions
Can I use the adult cut-offs for my child?
No. Adult BMI thresholds apply only to adults. For children and adolescents aged 2 to 19, BMI is plotted against age- and sex-specific growth charts. In the US, the CDC 2000 growth charts define underweight as below the 5th percentile, healthy weight as the 5th to 84th, overweight as the 85th to 94th, and obesity as the 95th percentile and above. A centile is a position on a reference distribution, not a direct measure of adiposity or health.
What does it mean if my BMI is 18.4 or 25.0?
You are at the boundary of a category, but the cut-offs are statistical dividers, not health cliffs. The J-shaped risk curve is flat near the nadir, so a fraction of a point either side does not change your individual risk in a meaningful way. Focus on the measures that capture central adiposity, waist circumference and waist-to-height ratio, because they add information that BMI alone misses.
Is my BMI number accurate if I entered my own height and weight?
Likely not. Self-reported height and weight systematically bias BMI downward by roughly 0.5 to 1.5 kg/m² on average, and the gap is larger in heavier individuals. People over-report height and under-report weight. For the tool to be useful, use measured values taken by a trained observer. The calculation itself runs in your browser and no data is sent anywhere.
Does a BMI of 30 mean I have obesity?
By the WHO classification, 30.0 kg/m² is the threshold for obese class I. But the category is a screening label, not a body fat reading. In NHANES data, a substantial minority of adults in the overweight category (BMI 25-29.9) have normal body fat by DXA, and a fraction of those in the normal category have excess body fat. The BMI cut-off is a population tool; it is not a substitute for a body composition assessment.
What is the obesity paradox?
The obesity paradox is the epidemiological observation that in some disease cohorts, heart failure, chronic kidney disease, a higher BMI is associated with lower mortality. It is an association, not a recommendation. The leading explanations are confounding by reverse causation (illness causing weight loss) and by smoking. The paradox describes a statistical pattern in data, not a biological reason to gain weight.